
Page 81 - Profile's Stock Exchange Handbook - 2025 Issue 3
P. 81
Profile’s Stock Exchange Handbook: 2025 - Issue 3 JSE - ARC
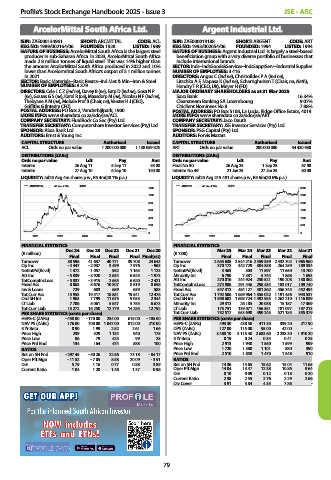
ArcelorMittal South Africa Ltd. Argent Industrial Ltd.
ISIN: ZAE000134961 SHORT: ARCMITTAL CODE: ACL ISIN: ZAE000019188 SHORT: ARGENT CODE: ART
REG NO: 1989/002164/06 FOUNDED: 1928 LISTED: 1989 REG NO: 1993/002054/06 FOUNDED: 1994 LISTED: 1994
NATURE OF BUSINESS: ArcelorMittal South Africa is the largest steel NATURE OF BUSINESS: Argent Industrial Ltd. is largely a steel-based
producer in sub-Saharan Africa. In 2023, ArcelorMittal South Africa beneficiation group with a very diverse portfolio of businesses that
made 2.8 million tonnes of liquid steel. This was 14% higher than include international brands.
the amount ArcelorMittal South Africa produced in 2022 and 10% SECTOR: Inds--IndsGoods&Services--IndsSupptServ--Industrial Supplies
lower than Arcelormittal South Africa’s output of 3.1 million tonnes NUMBER OF EMPLOYEES: 3 416
in 2021. DIRECTORS: Angus C (ind ne), Christofides P A (ind ne),
SECTOR: Basic Materials--Basic Resrcs--Ind Met & Min--Iron & Steel Litschka A F, Mapasa K (ind ne), Scharrighuisen T (Chair, ne, Neth),
NUMBER OF EMPLOYEES: 8 379 Hendry T R (CEO, UK), Meyer H (FD)
DIRECTORS: Cele L C Z (ind ne), Davey B (ne), Earp D (ind ne), Gosa N P MAJOR ORDINARY SHAREHOLDERS as at 31 Mar 2025
(ne), Gouws G S (ne), Karol R (ne), Maasdorp M (ne), Nicolau N F (ind ne), Saxo Bank 16.34%
Thebyane A M (ne), Mohale Prof B (Chair, ne), Verster H J (CEO), Clearstream Banking SA Luxembourg 9.07%
Griffiths G (Interim CFO) Citiclient Nominees No 8 7.88%
POSTAL ADDRESS: PO Box 2, Vanderbijlpark, 1900 POSTAL ADDRESS: PO Box 5108, La Lucia, Ridge Office Estate, 4019
MORE INFO: www.sharedata.co.za/sdo/jse/ACL MORE INFO: www.sharedata.co.za/sdo/jse/ART
COMPANY SECRETARY: FluidRock Co Sec (Pty) Ltd. COMPANY SECRETARY: Jaco Dauth
TRANSFER SECRETARY: Computershare Investor Services (Pty) Ltd. TRANSFER SECRETARY: JSE Investor Services (Pty) Ltd.
SPONSOR: Absa Bank Ltd. SPONSOR: PSG Capital (Pty) Ltd.
AUDITORS: Ernst & Young Inc. AUDITORS: Forvis Mazars
CAPITAL STRUCTURE Authorised Issued CAPITAL STRUCTURE Authorised Issued
ACL Ords no par value 1 200 000 000 1 138 059 825 ART Ords no par value 200 000 000 54 430 980
DISTRIBUTIONS [ZARc] DISTRIBUTIONS [ZARc]
Ords no par value Ldt Pay Amt Ords no par value Ldt Pay Amt
Interim 26 Aug 11 5 Sep 11 55.00 Final No 50 26 Aug 25 1 Sep 25 67.00
Interim 27 Aug 10 6 Sep 10 150.00 Interim No 49 21 Jan 25 27 Jan 25 60.00
LIQUIDITY: Jul25 Avg 4m shares p.w., R5.4m(20.1% p.a.) LIQUIDITY: Jul25 Avg 215 481 shares p.w., R5.6m(20.6% p.a.)
ARCMITTAL 40 Week MA INDM ARGENT 40 Week MA SUPS
1200 3000
1000 2500
800 2000
600 1500
400 1000
200 500
0 0
2021 2022 2023 2024 2025 2021 2022 2023 2024 2025
FINANCIAL STATISTICS FINANCIAL STATISTICS
(R million) Dec 24 Dec 23 Dec 22 Dec 21 Dec 20 (R ’000) Mar 25 Mar 24 Mar 23 Mar 22 Mar 21
Final Final Final Final Final(rst) Final Final Final Final Final
Turnover 38 596 41 637 40 771 39 708 24 643 Turnover 2 635 638 2 544 216 2 459 359 2 432 702 1 965 960
Op Inc - 4 447 - 2 937 3 499 7 976 - 963 Op Inc 370 172 342 729 304 358 264 259 189 534
NetIntPd(Rcvd) 1 372 1 057 952 1 163 1 123 NetIntPd(Rcvd) 3 463 303 11 597 11 650 13 700
Att Inc - 5 839 - 3 920 2 634 6 625 - 1 973 Minority Int 6 790 7 381 5 744 1 868 1 693
TotCompIncLoss - 5 837 - 3 915 2 655 6 620 - 2 421 Att Inc 270 016 244 924 230 521 190 208 130 362
Fixed Ass 8 063 8 676 10 307 8 819 8 658 TotCompIncLoss 274 986 291 446 298 434 183 017 109 740
Inv & Loans 729 683 659 639 583 Fixed Ass 547 312 484 127 481 362 456 745 452 494
Tot Curr Ass 15 953 19 517 18 851 19 541 12 476 Tot Curr Ass 1 792 506 1 669 964 1 355 022 1 191 456 943 537
Ord SH Int 1 963 7 799 11 675 9 053 2 344 Ord SH Int 1 898 602 1 695 724 1 492 955 1 262 210 1 116 039
LT Liab 7 706 5 061 5 547 5 755 6 673 Minority Int 29 312 26 185 20 038 15 187 17 369
Tot Curr Liab 15 272 16 250 12 779 14 285 12 792 LT Liab 175 751 139 071 156 351 181 097 197 213
PER SHARE STATISTICS (cents per share) Tot Curr Liab 752 517 653 690 490 245 521 185 355 379
HEPS-C (ZARc) - 458.00 - 170.00 234.00 615.00 - 185.00 PER SHARE STATISTICS (cents per share)
NAV PS (ZARc) 176.00 700.00 1 047.00 812.00 210.00 HEPS-C (ZARc) 493.30 438.50 411.30 339.20 217.90
3 Yr Beta 0.90 1.99 2.52 2.61 1.66 DPS (ZARc) 127.00 115.00 95.00 42.00 -
Price High 239 529 1 134 940 175 NAV PS (ZARc) 3 488.10 3 115.40 2 683.60 2 238.30 1 910.20
Price Low 86 79 423 99 25 3 Yr Beta 0.19 0.24 0.34 0.41 0.25
Price Prd End 134 164 474 888 100 Price High 2 913 1 940 1 550 1 599 999
RATIOS Price Low 1 720 1 380 1 101 880 390
Ret on SH Fnd - 297.45 - 50.26 22.56 73.18 - 84.17 Price Prd End 2 510 1 858 1 470 1 348 910
Oper Pft Mgn - 11.52 - 7.05 8.58 20.09 - 3.91 RATIOS
D:E 5.79 1.16 0.77 0.88 3.89 Ret on SH Fnd 14.36 14.65 15.62 15.04 11.65
Current Ratio 1.04 1.20 1.48 1.37 0.98 Oper Pft Mgn 14.04 13.47 12.38 10.86 9.64
D:E 0.10 0.09 0.12 0.18 0.20
Current Ratio 2.38 2.55 2.76 2.29 2.66
Div Cover 3.91 3.84 4.35 7.86 -
79