
Page 76 - Profile's Stock Exchange Handbook - 2025 Issue 3
P. 76
JSE - AFR Profile’s Stock Exchange Handbook: 2025 - Issue 3
Afrimat Ltd. AfroCentric Investment
Corporation Ltd.
ISIN: ZAE000086302 SHORT: AFRIMAT CODE: AFT
REG NO: 2006/022534/06 FOUNDED: 2005 LISTED: 2006
NATURE OF BUSINESS: Afrimat is a black empowered open pit mining ISIN: ZAE000078416 SHORT: AFRO-C CODE: ACT
company that supplies beneficiated materials and contracting REG NO: 1988/000570/06 FOUNDED: 1988 LISTED: 1988
services to the industrial minerals, building, construction, road NATURE OF BUSINESS: AfroCentric Group is a B-BBEE level 1
building, railroad and mining sectors. In addition, Afrimat supplies investment holding company listed on the Johannesburg Stock
bulk commodities to local and international markets. It operates Exchange (JSE). The Group owns and operates diverse healthcare-
in the Western Cape, Eastern Cape, KwaZulu-Natal, Free State, related enterprises that provide specialised medical scheme
Northern Cape, Gauteng, Limpopo and Mpumalanga as well as in administration and deliver healthcare products and services to
Mozambique. the public and private healthcare sectors. Sanlam Life Insurance
SECTOR: Basic Materials--Basic Resrcs--Ind Met & Min--General Mining Ltd. holds a controlling stake in the AfroCentric Group, fostering
NUMBER OF EMPLOYEES: 2 270 synergies and creating opportunities for both entities.
DIRECTORS: Kruger N A S (ne), Ramukhubathi C, Tuku S (ne), SECTOR: HlthCare--HtlhCare--HlthCarePrvdrs--HlthCareMgtSystems
van der Merwe J H P (ind ne), Louw F M (Chair, ld ind ne), Odendaal NUMBER OF EMPLOYEES: 5 944
M G (COO), Coffee G J (ne), Dotwana L (ne), Tsukudu P R E (ind ne), DIRECTORS: Dippenaar M (ne), Fernandes B (ld ind ne), Hanratty P B
van der Merwe J F (ld ind ne), van Wyk H J E (ind ne), von Wielligh M W (ne), le Roux A M (ind ne), Mkhize K (ne), Morule K (ind ne), Munisi
(Chair, ind ne), van Heerden A J (CEO), de Wit P G S (CFO) Dr N D (ne), Mokgokong Dr A T M (Chair, ne), Madungandaba M J
MAJOR ORDINARY SHAREHOLDERS as at 11 Feb 2025 (Dep Chair, ne), Moloele T (CFO), van Wyk G (Group CEO)
Public Investment Corporation (SOC) Ltd. 13.09% MAJOR ORDINARY SHAREHOLDERS as at 30 Jun 2024
F du Toit Trust 11.05% Sanlam Group 58.78%
Korum Trust 5.64% ARC Financial Services Investments (Pty) Ltd. 8.81%
POSTAL ADDRESS: PO Box 5278, Tyger Valley, 7536 Community Healthcare Holdings (Pty) Ltd. 7.48%
MORE INFO: www.sharedata.co.za/sdo/jse/AFT POSTAL ADDRESS: PO Box 1101, Florida Glen, Roodepoort, 1708
COMPANY SECRETARY: Catharine Burger MORE INFO: www.sharedata.co.za/sdo/jse/ACT
TRANSFER SECRETARY: Computershare Investor Services (Pty) Ltd. COMPANY SECRETARY: Lebohang Mpumlwana
SPONSOR: Valeo Capital (Pty) Ltd. TRANSFER SECRETARY: Computershare Investor Services (Pty) Ltd.
AUDITORS: PwC Inc. SPONSOR: Questco Corporate Advisory (Pty) Ltd.
CAPITAL STRUCTURE Authorised Issued AUDITORS: KPMG Inc.
AFT Ords no par val 1 000 000 000 160 297 456 CAPITAL STRUCTURE Authorised Issued
DISTRIBUTIONS [ZARc] ACT Ords no par value 1 000 000 000 840 684 592
Ords no par val Ldt Pay Amt DISTRIBUTIONS [ZARc]
Final No 36 3 Jun 25 9 Jun 25 15.00 Ords no par value Ldt Pay Amt
Interim No 35 19 Nov 24 25 Nov 24 10.00 Interim No 23 6 May 25 12 May 25 6.00
LIQUIDITY: Jul25 Avg 2m shares p.w., R130.2m(73.1% p.a.) Interim No 22 7 May 24 13 May 24 11.00
LIQUIDITY: Jul25 Avg 371 208 shares p.w., R788 266.2(2.3% p.a.)
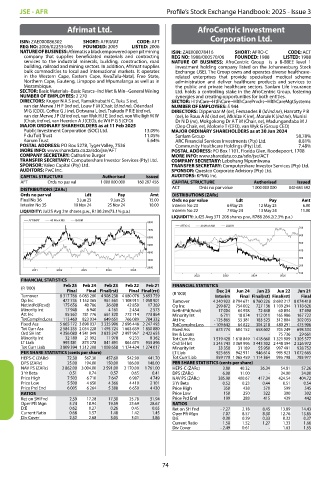
AFRIMAT 40 Week MA BASM
8000
AFRO-C 40 Week MA JS2011
700
7000
600
6000
500
5000
400
4000
300
3000
200
2000
2021 2022 2023 2024 2025
100
2022 2023 2024 2025
FINANCIAL STATISTICS
(R ’000) Feb 25 Feb 24 Feb 23 Feb 22 Feb 21 FINANCIAL STATISTICS
Final Final Final(rst) Final Final(rst) Dec 24 Jun 24 Jun 23 Jun 22 Jun 21
Turnover 8 317 766 6 083 280 4 908 238 4 680 078 3 693 759 (R ’000) Interim Final Final(rst) Final(rst) Final
Op Inc 477 735 1 152 365 961 561 1 108 911 1 058 901 Turnover 4 240 923 8 794 671 8 760 226 8 693 217 8 074 418
NetIntPd(Rcvd) 175 656 40 786 26 698 42 850 17 269 Op Inc 299 872 754 002 727 136 1 109 294 1 118 626
Minority Int 17 948 6 940 4 161 2 454 2 573 NetIntPd(Rcvd) 17 004 64 958 72 448 60 834 37 498
Att Inc 95 562 781 776 661 320 772 714 773 864 Minority Int 6 711 18 874 112 011 165 986 167 722
TotCompIncLoss 113 460 823 034 649 651 766 089 784 332 Att Inc - 125 865 55 381 183 523 312 804 302 033
Fixed Ass 5 665 172 3 898 037 3 335 996 2 696 448 2 247 493 TotCompIncLoss - 109 642 64 822 304 218 480 291 475 906
Tot Curr Ass 2 584 355 2 054 228 1 495 724 1 663 639 1 850 880 Fixed Ass 673 774 604 152 658 602 705 249 698 334
Ord SH Int 4 356 080 4 541 049 3 835 247 2 997 967 2 422 655 Inv & Loans - - - 75 736 29 661
Minority Int 32 180 21 992 11 978 9 233 8 362 Tot Curr Ass 1 519 428 1 618 849 1 418 660 1 321 909 1 305 577
LT Liab 995 581 873 278 841 491 864 673 933 896 Ord SH Int 3 245 743 3 369 996 3 443 302 2 448 394 2 326 972
Tot Curr Liab 3 809 394 1 312 208 1 008 658 1 174 424 1 274 017 Minority Int 33 350 31 189 55 950 997 491 928 752
PER SHARE STATISTICS (cents per share) LT Liab 923 655 942 911 946 614 995 923 1 072 665
HEPS-C (ZARc) 72.30 567.30 457.60 542.90 441.70 Tot Curr Liab 959 779 1 065 459 1 114 364 995 798 785 977
DPS (ZARc) 25.00 194.00 150.00 186.00 148.00 PER SHARE STATISTICS (cents per share)
NAV PS (ZARc) 2 862.00 3 004.00 2 591.00 2 170.00 1 761.00 HEPS-C (ZARc) 3.80 40.32 36.34 54.81 57.26
3 Yr Beta 0.51 0.74 0.57 0.65 0.41 DPS (ZARc) 6.00 11.00 - 34.00 34.00
Price High 7 503 6 710 7 647 6 987 4 749 NAV PS (ZARc) 385.90 400.67 417.34 424.54 404.72
Price Low 5 500 4 650 4 366 4 410 2 101 3 Yr Beta 0.52 0.23 0.44 0.51 0.54
Price Prd End 6 005 6 264 5 388 6 650 4 430 Price High 350 438 570 599 545
RATIOS Price Low 150 250 322 300 302
Ret on SH Fnd 2.59 17.28 17.30 25.78 31.94 Price Prd End 199 288 415 439 442
Oper Pft Mgn 5.74 18.94 19.59 23.69 28.67 RATIOS
D:E 0.62 0.27 0.26 0.45 0.65 Ret on SH Fnd - 7.27 2.18 8.45 13.89 14.43
Current Ratio 0.68 1.57 1.48 1.42 1.45 Oper Pft Mgn 7.07 8.57 8.30 12.76 13.85
Div Cover 2.52 2.68 3.05 3.01 3.86 D:E 0.30 0.29 0.33 0.32 0.37
Current Ratio 1.58 1.52 1.27 1.33 1.66
Div Cover - 2.49 0.61 - 1.63 1.55
74