
Page 190 - shbh24_complete
P. 190
JSE – SAS Profile’s Stock Exchange Handbook: 2024 – Issue 3
Sasol Ltd. Schroder European Real Estate
SAS Investment Trust plc
ISIN: ZAE000006896 SHORT: SASOL CODE: SOL
ISIN: ZAE000151817 SHORT: BEE-SASOL CODE: SOLBE1 SCH
REG NO: 1979/003231/06 FOUNDED: 1950 LISTED: 1979 ISIN: GB00BY7R8K77 SHORT: SERE CODE: SCD
NATURE OF BUSINESS: Sasol is South Africa’s leading chemicals and REG NO: 09382477 FOUNDED: 2015 LISTED: 2015
energy organisation with a global presence. Sasol is purpose-driven and NATUREOF BUSINESS:SchroderEuropeanRealEstateInvestmentTrust
resolute in our transition to being a sustainable entity while creating plc (the ‘Company’/‘SEREIT’) aims to provide shareholders with a regular
shared value for all its stakeholders. and attractive level of income together with the potential for income and
Sasol partners with various organisations to develop and implement capital growth through investing in commercial real estate in Continental
innovative solutions. Europe.
Sasol is listed on the Johannesburg Stock Exchange (JSE) and the New SEREIT invests in European growth cities and regions. It is a UK
York Stock Exchange (NYSE). closed-ended real estate investment company incorporated on 9 January
Sasol is committed to sustainability, supporting the Paris Agreement and 2015. The Company has a premium listing on the Official List of the UK
accelerating our transition to Net Zero emissions ambition by 2050. Listing Authority and its shares have been trading on the Main Market of
SECTOR: Basic Materials—Chemicals—Chemicals—Chemicals:Diversified the London Stock Exchange (ticker: SERE) since 9 December 2015. It also
has a secondary listing on the Main Board of the Johannesburg Stock
NUMBER OF EMPLOYEES: 28 630 Exchange (ticker: SCD).
DIRECTORS: Cuambe M J (ind ne, Moz), Cumming T (ind ne), SECTOR: RealEstate—RealEstate—REITS—Diversified
Flöel M (ind ne, German), Harper K (ind ne, USA), Kahla V D, NUMBER OF EMPLOYEES: 0
Kennealy G M B (ind ne), Matyumza N (ind ne), Nkeli M E K (ind ne),
Schierenbeck A (ind ne), Subramoney S (ne), Baloyi S (CEO & President), DIRECTORS: Beddy M (ind ne), Edwards E (ind ne), Patterson M
Dube M B N (Interim Chair, ld ind ne), Rossouw H (CFO) (ind ne, UK), Thompson J (ind ne, UK), Berney Sir J (Chair, ind ne, UK)
MAJOR ORDINARY SHAREHOLDERS as at 30 Jun 2023 MAJOR ORDINARY SHAREHOLDERS as at 30 Sep 2023
Government Employees Pension Fund 18.72% Truffle Asset Management (Pty) Ltd. 10.00%
Industrial Development Corporation of SA Ltd. 8.31% Schroders plc 8.04%
POSTAL ADDRESS: Private Bag X10014, Sandton, 2196 Investec Wealth & Investment Ltd. 6.06%
MORE INFO: www.sharedata.co.za/sdo/jse/SOL MORE INFO: www.sharedata.co.za/sdo/jse/SCD
COMPANY SECRETARY: Helaine Joubert COMPANY SECRETARY: Schroder Investment Management Ltd.
TRANSFER SECRETARY: Computershare Investor Services (Pty) Ltd.
TRANSFER SECRETARY: JSE Investor Services (Pty) Ltd.
SPONSOR: Merrill Lynch SA (Pty) Ltd. SPONSOR: PSG Capital (Pty) Ltd.
AUDITORS: PwC Inc. AUDITORS: PwC LLP
CAPITAL STRUCTURE AUTHORISED ISSUED
CAPITAL STRUCTURE AUTHORISED ISSUED
SOL Ords no par value 1 127 690 590 642 143 757 SCD Ords GBP0.10p ea - 133 734 686
SOLBE1 BEE ords no par value 158 331 335 6 331 347 DISTRIBUTIONS [EURc]
Ords GBP0.10p ea Ldt Pay Amt
DISTRIBUTIONS [ZARc]
9 Jul 24
Ords no par value Ldt Pay Amt Interim No 32 9 Apr 24 12 Aug 24 1.48
10 May 24
1.48
Quarterly No 31
Interim No 83 12 Mar 24 18 Mar 24 200.00
Final No 82 12 Sep 23 18 Sep 23 1000.00 LIQUIDITY: Jul24 Avg 118 729 shares p.w., R1.9m(4.6% p.a.)
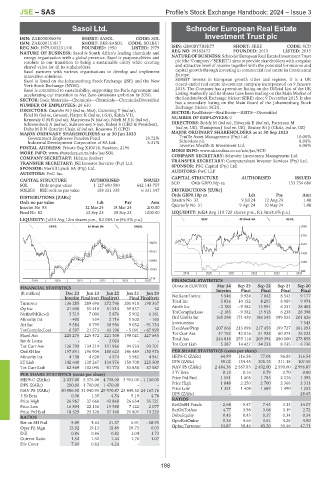
LIQUIDITY: Jul24 Avg 12m shares p.w., R2 084.1m(96.5% p.a.) REIV 40 Week MA SERE
CHES 40 Week MA SASOL 2568
2192
39270
1815
30131
1439
20992
1063
11853
686
2019 | 2020 | 2021 | 2022 | 2023 | 2024
2714
2019 | 2020 | 2021 | 2022 | 2023 | 2024 FINANCIAL STATISTICS
(Amts in EUR’000) Mar 24 Sep 23 Sep 22 Sep 21 Sep 20
FINANCIAL STATISTICS Interim Final Final Final Final
(R million) Dec 23 Jun 23 Jun 22 Jun 21 Jun 20
Interim Final(rst) Final(rst) Final Final(rst) NetRent/InvInc 5 546 9 924 7 842 8 542 9 177
Turnover 136 285 289 696 272 746 201 910 190 367 Total Inc 5 836 10 152 8 293 8 989 9 974
Op Inc 21 696 55 418 51 514 39 837 52 Attrib Inc - 2 183 - 9 382 13 991 6 237 28 402
NetIntPd(Rcvd) 3 519 7 006 5 876 5 902 6 381 TotCompIncLoss - 2 183 - 9 382 13 918 6 238 28 398
Minority Int - 400 534 2 716 1 500 - 163 Ord UntHs Int 165 298 171 439 188 243 199 532 201 826
Att Inc 9 584 8 799 38 956 9 032 - 91 754 Investments - - - - 7 543
TotCompIncLoss 6 597 21 573 43 196 - 5 091 - 67 999 FixedAss/Prop 207 066 213 098 217 456 199 727 181 093
Fixed Ass 225 276 225 472 221 308 198 021 227 645 Tot Curr Ass 37 752 42 016 51 938 80 373 25 022
Inv & Loans - - 2 024 - - Total Ass 244 818 255 114 269 394 280 100 278 858
Tot Curr Ass 126 799 134 219 131 966 94 533 93 701 Tot Curr Liab 5 387 14 427 34 233 8 135 6 736
Ord SH Int 197 891 196 904 188 623 146 489 150 976 PER SHARE STATISTICS (cents per share)
Minority Int 4 138 4 620 4 574 5 982 4 941 HEPS-C (ZARc) 64.99 116.58 77.04 86.88 116.54
LT Liab 142 640 130 267 134 576 150 708 225 500 DPS (ZARc) 59.02 134.45 208.75 211.18 107.55
Tot Curr Liab 82 469 102 045 91 773 53 858 87 587 NAV PS (ZARc) 2 484.36 2 567.85 2 492.00 2 590.00 2 996.87
3 Yr Beta 0.13 0.16 0.79 0.70 0.80
PER SHARE STATISTICS (cents per share)
HEPS-C (ZARc) 2 037.00 5 375.00 4 758.00 3 953.00 - 1 150.00 Price Prd End 1 551 1 605 1 785 2 176 1 392
DPS (ZARc) 200.00 1 700.00 1 470.00 - - Price High 1 848 2 250 2 700 2 368 2 311
NAV PS (ZARc) 30 986.50 31 040.95 29 970.87 23 449.50 24 167.76 Price Low 1 351 1 404 1 689 1 490 1 252
3 Yr Beta 0.38 1.35 4.54 5.19 4.78 DPS (ZARc) - - - - 28.65
Price High 26 967 37 668 43 860 26 654 35 721 RATIOS
Price Low 16 804 22 136 19 588 7 122 2 077 RetOnSH Funds - 2.64 - 5.47 7.43 3.13 14.07
Price Prd End 18 529 23 326 37 168 21 801 13 220 RetOnTotAss 4.77 3.98 3.08 3.19 2.72
RATIOS Debt:Equity 0.43 0.43 0.37 0.34 0.34
Ret on SH Fnd 9.09 4.63 21.57 6.91 - 58.95 OperRetOnInv 5.36 4.66 3.61 4.28 4.90
Oper Pft Mgn 15.92 19.13 18.89 19.73 0.03 OpInc:Turnover 53.87 50.46 43.20 50.48 47.71
D:E 0.86 0.86 0.82 1.04 1.73
Current Ratio 1.54 1.32 1.44 1.76 1.07
Div Cover 7.60 0.82 4.24 - -
188