
Page 185 - shbh24_complete
P. 185
Profile’s Stock Exchange Handbook: 2024 – Issue 3 JSE – SAC
SA Corporate Real Estate Ltd. Safari Investments RSA Ltd.
SAC SAF
ISIN: ZAE000203238 SHORT: SA CORP CODE: SAC ISIN: ZAE000188280 SHORT: SAFARI CODE: SAR
REG NO: 2015/015578/06 FOUNDED: 1995 LISTED: 1995 REG NO: 2000/015002/06 FOUNDED: 2000 LISTED: 2014
NATURE OF BUSINESS: SAC is a JSE-listed Real Estate Investment Trust NATURE OF BUSINESS: Safari Investments RSA Ltd. is a property
(“REIT”) and, together with all its subsidiaries, owns a diversified investment company listed on the JSE as a Real Estate Investment Trust
portfolio of quality industrial, retail and residential buildings located (“REIT”). Through selective investments in property, especially
primarily in the major metropolitan areas of South Africa, with a secondary convenience and small regional shopping centres, we create value for our
node in Zambia. stakeholders as we strive for sustainable growth and earnings.
SAC is one of the oldest established property companies in the South SECTOR: RealEstate—RealEstate—REITS—Retail
African market. NUMBER OF EMPLOYEES: 28
SECTOR: RealEstate—RealEstate—REITS—Diversified DIRECTORS: HeronGJ(ind ne), Matshoba-Ramuedzisi T (ld ind ne),
NUMBER OF EMPLOYEES: 230 PienaarPA(ind ne), Herring S (Chair, ne, UK), Engelbrecht D C (CEO),
DIRECTORS: Ford-Hoon N (ind ne), Hendricks E (ind ne), Venter W L (CFO)
HeronGJ(ind ne), Mafoyane S (ind ne), Mojalefa S J, MAJOR ORDINARY SHAREHOLDERS as at 27 Sep 2023
MosetlhiOR(ld ind ne), Moloto A (Chair, ind ne), Mackey T R (CEO), Heriot Properties (Pty) Ltd. 36.32%
Moodley S (CFO), Radebe N (COO) Maitlantic 1038 (Pty) Ltd. 17.05%
MAJOR ORDINARY SHAREHOLDERS as at 16 May 2024 Heriot Investments (Pty) Ltd. 10.02%
Government Employees Pension Fund 17.27% POSTAL ADDRESS: 410 Lynnwood Road, Lynnwood, Pretoria, 0081
Old Mutual Group 11.93% MORE INFO: www.sharedata.co.za/sdo/jse/SAR
Peresec Prime Brokers (Pty) Ltd. 11.82% COMPANY SECRETARY: Pieter van Niekerk
POSTAL ADDRESS: Suite 95, Private Bag X 9976, Sandton City, 2146 TRANSFER SECRETARY: Computershare Investor Services (Pty) Ltd.
MORE INFO: www.sharedata.co.za/sdo/jse/SAC SPONSOR: Valeo Capital (Pty) Ltd.
COMPANY SECRETARY: Jacqui Grove AUDITORS: BDO South Africa Inc.
TRANSFER SECRETARY: Computershare Investor Services (Pty) Ltd.
SPONSORS: Nedbank Corporate and Investment Banking, a division of CAPITAL STRUCTURE AUTHORISED ISSUED
Nedbank Ltd. SAR Ords no par value 2 000 000 000 257 826 016
AUDITORS: PwC Inc. DISTRIBUTIONS [ZARc]
CAPITAL STRUCTURE AUTHORISED ISSUED Ords no par value Ldt Pay Amt
SAC Ords no par 4 000 000 000 2 514 732 095 Final No 21 9 Jul 24 15 Jul 24 31.00
Interim No 20 5 Dec 23 11 Dec 23 30.00
DISTRIBUTIONS [ZARc]
Ords no par Ldt Pay Amt LIQUIDITY: Jul24 Avg 155 299 shares p.w., R864 407.8(3.1% p.a.)
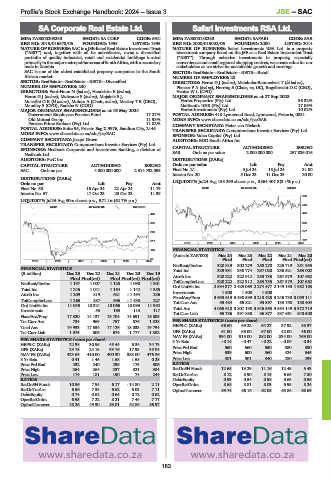
Final No 58 16 Apr 24 22 Apr 24 11.79 REIV 40 Week MA SAFARI
Interim No 57 17 Oct 23 23 Oct 23 11.39
639
LIQUIDITY: Jul24 Avg 30m shares p.w., R71.1m(62.7% p.a.)
549
REIV 40 Week MA SA CORP
423 458
355 368
277
286
217 187
2019 | 2020 | 2021 | 2022 | 2023 | 2024
149 FINANCIAL STATISTICS
(Amts in ZAR’000) Mar 24 Mar 23 Mar 22 Mar 21 Mar 20
80 Final Final Final Final Final(rst)
2019 | 2020 | 2021 | 2022 | 2023 | 2024
NetRent/InvInc 320 819 302 279 258 278 225 719 251 953
FINANCIAL STATISTICS Total Inc 329 931 338 774 297 020 236 521 263 002
(R million) Dec 23 Dec 22 Dec 21 Dec 20 Dec 19 Attrib Inc 328 222 322 912 253 735 267 579 107 662
Final Final(rst) Final Final(rst) Final(rst)
NetRent/InvInc 1 197 1 007 1 125 1 090 1 301 TotCompIncLoss 328 222 322 912 253 735 267 579 107 662
Ord UntHs Int 2 594 377 2 429 069 2 274 477 2 149 190 1 982 163
Total Inc 1 246 1 041 1 164 1 142 1 385 Investments 1 500 1 500 1 500 - -
Attrib Inc 1 209 819 621 - 1 494 236 FixedAss/Prop 3 693 619 3 430 599 3 213 425 3 246 730 3 059 111
TotCompIncLoss 1 263 887 696 - 1 438 227
93 597
133 758
150 404
55 484
65 821
Ord UntHs Int 11 035 10 321 10 066 10 093 11 992 Tot Curr Ass 4 065 618 3 807 198 3 646 553 3 554 149 3 372 719
Total Ass
Investments - 53 163 113 117
FixedAss/Prop 17 320 14 137 13 704 14 691 16 805 Tot Curr Liab 65 736 391 888 86 877 837 661 840 500
Tot Curr Ass 734 969 757 576 1 328 PER SHARE STATISTICS (cents per share)
Total Ass 19 933 17 534 17 126 18 033 19 794 HEPS-C (ZARc) 56.60 69.22 64.27 37.92 35.37
Tot Curr Liab 1 375 806 674 1 777 1 382 DPS (ZARc) 61.00 65.00 57.00 42.00 46.00
NAV PS (ZARc) 994.00 915.00 882.00 834.00 769.00
PER SHARE STATISTICS (cents per share)
HEPS-C (ZARc) 22.98 30.96 48.44 6.34 34.73 3 Yr Beta - 0.14 - 0.47 - 0.22 - 0.09 0.34
DPS (ZARc) 23.18 24.15 33.16 17.93 38.04 Price Prd End 560 560 550 380 330
NAV PS (ZARc) 423.65 410.00 400.30 383.00 476.86 Price High 639 600 560 424 545
3 Yr Beta 0.41 1.46 1.68 1.58 0.25 Price Low 501 501 340 280 299
Price Prd End 232 240 235 173 306 RATIOS
Price High 254 264 237 321 384 RetOnSH Funds 12.65 13.29 11.16 12.45 5.43
Price Low 174 181 150 74 244 RetOnTotAss 8.12 8.90 8.15 6.65 7.80
RATIOS Debt:Equity 0.53 0.54 0.58 0.63 0.56
RetOnSH Funds 10.96 7.94 6.17 - 14.80 2.11 OperRetOnInv 8.68 8.81 8.03 6.95 8.24
RetOnTotAss 6.56 7.38 6.62 6.03 7.11 OpInc:Turnover 59.74 66.16 62.08 65.86 68.69
Debt:Equity 0.74 0.62 0.64 0.72 0.62
OperRetOnInv 6.95 7.22 8.21 7.44 7.77
OpInc:Turnover 48.26 49.30 53.01 52.86 56.97
183