
Page 188 - shbh24_complete
P. 188
JSE – SAN Profile’s Stock Exchange Handbook: 2024 – Issue 3
Santam Ltd. Santova Ltd.
SAN SAN
ISIN: ZAE000093779 SHORT: SANTAM CODE: SNT ISIN: ZAE000159711 SHORT: SANTOVA CODE: SNV
REG NO: 1918/001680/06 FOUNDED: 1918 LISTED: 1964 REG NO: 1998/018118/06 FOUNDED: 1998 LISTED: 2002
NATURE OF BUSINESS: Santam is a proudly South African general NATURE OF BUSINESS: The Santova Group is an international,
insurance group with a growing international premium contribution. technology-based trade solutions specialist, delivering innovative
Headquartered in Cape Town, South Africa, Santam was founded in 1918 end-to-end supply chain solutions. The Group is represented in 11
and listed on the JSE in 1964 under the insurance (non-life) sector. The countries through its own offices in South Africa, Australia, Germany,
group has secondary listings on the Namibian Stock Exchange and A2X Hong Kong, Mauritius, the Netherlands, Singapore, Thailand, United
Markets Exchange. Santam is a subsidiary of South African financial Kingdom, United States and Vietnam.
services group Sanlam, which holds 62.3% of Santam’s shares. SECTOR:Inds—IndsGoods&Services—IndsTransport—MarineTransport
SECTOR: Fins—Insurance—Non-life Insurance—Property&CasualtyIns NUMBER OF EMPLOYEES: 262
NUMBER OF EMPLOYEES: 6 339 DIRECTORS: GarnerE((ind ne), Ngubo E (ind ne), van Zyl A L,
DIRECTORS: Chauke M (ind ne), Da Silva C (ind ne), Fandeso M P Woodroffe T (ind ne), Stewart M E (Chair, ind ne), Gerber G (CEO),
(ld ind ne), HanrattyPB(ne), Loxton D (ind ne), Mlondolozi M (ne), Robertson J (FD)
Mukhuba A (ne), NgulubeJJ(ne), Speckmann P (ind ne), MAJOR ORDINARY SHAREHOLDERS as at 29 Feb 2024
Swartz L (ind ne), Moholi N T (Chair, ind ne), Madzinga T (CEO), Nel Barca Capital 13.95%
H D (CFO), Olivier W (CFO) A L van Zyl 12.73%
MAJOR ORDINARY SHAREHOLDERS as at 31 Dec 2023 Glen Henry Gerber 5.73%
Sanlam Ltd. 62.60% POSTAL ADDRESS: PO Box 6148, Durban, 4000
POSTAL ADDRESS: PO Box 3881, Tyger Valley, 7536 MORE INFO: www.sharedata.co.za/sdo/jse/SNV
MORE INFO: www.sharedata.co.za/sdo/jse/SNT COMPANY SECRETARY: J A Lupton
COMPANY SECRETARY: Ruwaida Eksteen TRANSFER SECRETARY: Computershare Investor Services (Pty) Ltd.
TRANSFER SECRETARY: Computershare Investor Services (Pty) Ltd. SPONSOR: River Group
SPONSOR: Investec Bank Ltd. AUDITORS: Moore Stephens
AUDITORS: KPMG Inc. CAPITAL STRUCTURE AUTHORISED ISSUED
CAPITAL STRUCTURE AUTHORISED ISSUED SNV Ords no par 300 000 000 129 609 951
SNT Ords no par value 150 000 000 115 131 417
DISTRIBUTIONS [ZARc]
DISTRIBUTIONS [ZARc] Ords no par Ldt Pay Amt
Ords no par value Ldt Pay Amt Final No 7 25 Jun 19 1 Jul 19 7.50
Final No 138 18 Mar 24 25 Mar 24 905.00 Final No 6 26 Jun 18 2 Jul 18 7.00
Special 3 Oct 23 9 Oct 23 1780.00
LIQUIDITY: Jul24 Avg 410 816 shares p.w., R3.1m(16.5% p.a.)
LIQUIDITY: Jul24 Avg 287 541 shares p.w., R84.8m(13.0% p.a.)
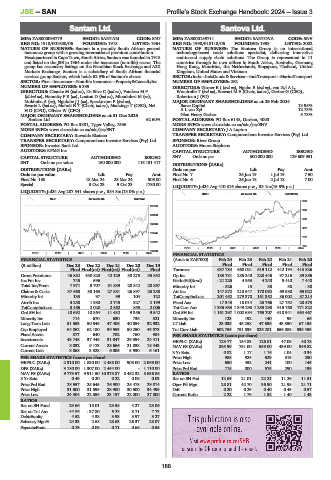
INDT 40 Week MA SANTOVA
NLIF 40 Week MA SANTAM
980
39778
809
36360
638
32943
467
29525
296
26107
125
2019 | 2020 | 2021 | 2022 | 2023 | 2024
22689
2019 | 2020 | 2021 | 2022 | 2023 | 2024
FINANCIAL STATISTICS
FINANCIAL STATISTICS (Amts in ZAR’000) Feb 24 Feb 23 Feb 22 Feb 21 Feb 20
(R million) Dec 23 Dec 22 Dec 21 Dec 20 Dec 19 Final Final Final Final Final
Final Final(rst) Final(rst) Final(rst) Final Turnover 637 784 668 021 619 112 442 194 413 826
Gross Premiums 46 882 430 820 42 129 38 273 35 852 Op Inc 183 731 285 240 228 446 97 216 89 856
Inc Fm Inv 745 696 - - - NetIntPd(Rcvd) - 21 225 4 953 4 240 5 410 7 440
Total Inc/Prem 7 971 5 707 31 839 28 842 28 867 Minority Int - 526 15 38 38 - 30
Claims & Costs 37 668 30 163 27 881 26 897 25 258 Att Inc 147 872 210 647 170 092 69 680 65 022
Minority Int 133 97 99 104 122 TotCompIncLoss 201 452 279 370 161 352 86 002 87 214
Attrib Inc 3 250 1 980 2 745 327 2 199 Fixed Ass 17 343 18 014 25 766 27 752 28 573
TotCompIncLoss 3 455 2 020 2 862 855 2 006 Tot Curr Ass 1 335 633 1 349 298 1 255 298 915 760 771 822
Ord SH Int 10 692 10 864 11 432 9 356 9 542 Ord SH Int 1 161 297 1 002 684 765 707 618 941 564 467
Minority Int 714 670 630 736 521 Minority Int 123 192 140 99 66
Long-Term Liab 51 553 50 546 47 406 40 054 32 932 LT Liab 23 035 45 258 47 636 43 350 67 195
Cap Employed 64 062 62 180 59 553 50 250 43 073 Tot Curr Liab 602 755 751 835 825 281 656 385 538 453
Fixed Assets 877 640 702 760 984 PER SHARE STATISTICS (cents per share)
Investments 43 748 37 446 31 047 29 394 24 411 HEPS-C (ZARc) 123.77 154.83 126.81 47.08 40.78
Current Assets 8 032 9 173 28 666 21 038 18 443 NAV PS (ZARc) 895.99 751.00 559.00 439.00 349.82
Current Liab 3 068 3 328 6 005 5 930 6 161
3 Yr Beta 0.82 1.17 1.16 1.04 0.34
PER SHARE STATISTICS (cents per share) Price High 985 924 629 319 290
HEPS-C (ZARc) 2 310.00 1 830.00 2 488.00 905.00 2 069.00 Price Low 650 452 241 100 145
DPS (ZARc) 3 180.00 1 307.00 2 454.00 - 1 110.00 Price Prd End 715 800 575 290 199
NAV PS (ZARc) 9 779.57 9 911.50 10 373.87 8 482.32 8 636.86 RATIOS
3 Yr Beta 0.49 0.20 0.22 0.06 0.03 Ret on SH Fnd 12.69 21.01 22.21 11.26 11.51
Price Prd End 28 657 25 645 26 900 25 478 29 014 Oper Pft Mgn 28.81 42.70 36.90 21.98 21.71
Price High 31 600 31 599 28 900 30 500 34 499 D:E 0.20 0.29 0.40 0.43 0.57
Price Low 24 504 22 856 23 137 22 000 27 800 Current Ratio 2.22 1.79 1.52 1.40 1.43
RATIOS
Ret on SH Fund 29.66 18.01 23.58 4.27 23.06
Ret on Tot Ass - 44.86 - 37.80 6.28 3.71 7.73
Debt:Equity 4.52 4.38 3.93 3.97 3.27
Solvency Mgn% 24.33 2.68 28.63 26.37 28.07
Payouts:Prem 0.79 0.09 0.71 0.66 0.55
186