
Page 192 - shbh24_complete
P. 192
JSE – SEB Profile’s Stock Exchange Handbook: 2024 – Issue 3
Sebata Holdings Ltd. Sephaku Holdings Ltd.
SEB SEP
ISIN: ZAE000260493 SHORT: SEBATA CODE: SEB ISIN: ZAE000138459 SHORT: SEPHAKU CODE: SEP
REG NO: 1998/003821/06 FOUNDED: 1998 LISTED: 1998 REG NO: 2005/003306/06 FOUNDED: 2005 LISTED: 2009
NATUREOF BUSINESS:SebataHoldingsLtd.(“Sebata”or”theGroup”or NATURE OF BUSINESS: Sephaku Holdings Ltd. is a building and
“the Company”) provides tailor-made enterprise management, water construction materials company with a portfolio of investments in the
management and ICT solutions as well as accounting and professional cement sector in South Africa. The Company’s core investments are a 36%
services. The Group is split into three investment divisions: Water stake in Dangote Cement SA (Pty) Ltd. and 100% in Métier Mixed
Management Solutions, Software Solutions and Consultancy Services. Concrete (Pty) Ltd. SepHold’s strategy is to generate growth and realise
SECTOR:Technology—Technology—Software&CompSer—ComputerService value for shareholders through the production of cement and ready mixed
NUMBER OF EMPLOYEES: 1 253 concrete in Southern Africa.
DIRECTORS: Passmore D (ld ind ne), Strydom D L, Viljoen R J, SECTOR: Inds—Constr&Mats—Constr&Mats—Cement
Di Siena D A (Chair, ind ne), King C A (Strategic Finance), NUMBER OF EMPLOYEES: 241
Morris I G (CEO & FD), DuvenhagePH(ind ne), HamillTW(ne) DIRECTORS: Bulo B (ind ne), Janse van RensburgMJ(ind ne),
MAJOR ORDINARY SHAREHOLDERS as at 24 Oct 2023 Mohuba Dr L (ne), NgoashengMM(ind ne), Williams B (Chair, ind ne),
Laird Investments (Pty) Ltd. 71.79% Capes K J (CEO), Crafford-Lazarus N R (FD)
Kamberg Investment Holdings 9.34% MAJOR ORDINARY SHAREHOLDERS as at 19 Jun 2024
MICROmega Financial Services (Pty) Ltd. 3.29% Safika Resources (Pty) Ltd. 12.08%
POSTAL ADDRESS: Private Bag X9966, Sandton, 2146 Citiclient Nominees No 8 NY GW 10.63%
MORE INFO: www.sharedata.co.za/sdo/jse/SEB Mr David Fraser 6.10%
COMPANY SECRETARY: Luschenca Mayer POSTAL ADDRESS: PO Box 7651, Centurion, 0046
TRANSFER SECRETARY: Singular Systems (Pty) Ltd. MORE INFO: www.sharedata.co.za/sdo/jse/SEP
SPONSOR: Merchantec Capital COMPANY SECRETARY: Acorim (Pty) Ltd.
AUDITORS: Nexia SAB&T Inc. TRANSFER SECRETARY: Computershare Investor Services (Pty) Ltd.
SPONSOR: Questco Corporate Advisory (Pty) Ltd.
CAPITAL STRUCTURE AUTHORISED ISSUED
SEB Ords 1c ea 200 000 000 114 915 089 AUDITORS: PwC Inc.
CAPITAL STRUCTURE AUTHORISED ISSUED
DISTRIBUTIONS [ZARc] SEP Ords no par value 1 000 000 000 254 486 436
Ords 1c ea Ldt Pay Amt
Special No 9 17 Oct 23 23 Oct 23 25.00 LIQUIDITY: Jul24 Avg 1m shares p.w., R1.4m(26.8% p.a.)
Special No 8 17 Apr 18 23 Apr 18 300.00 CONM 40 Week MA SEPHAKU
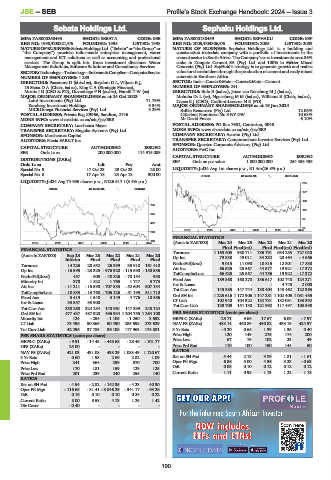
LIQUIDITY: Jul24 Avg 74 935 shares p.w., R126 617.1(3.4% p.a.)
215
SCOM 40 Week MA SEBATA
177
139
773
101
605
63
437
25
2019 | 2020 | 2021 | 2022 | 2023 | 2024
268
FINANCIAL STATISTICS
100
2019 | 2020 | 2021 | 2022 | 2023 | 2024 (Amts in ZAR’000) Mar 24 Mar 23 Mar 22 Mar 21 Mar 20
Final Final(rst) Final Final(rst) Final(rst)
FINANCIAL STATISTICS Turnover 1 163 603 980 711 785 791 634 253 727 040
(Amts in ZAR’000) Sep 23 Mar 23 Mar 22 Mar 21 Mar 20
Interim Final Final Final Final Op Inc 79 838 49 011 34 232 20 464 - 4 566
NetIntPd(Rcvd) 9 015 11 090 10 815 12 301 17 830
Turnover 14 226 28 652 25 399 33 910 161 410
Op Inc - 16 595 - 23 325 - 976 920 - 115 690 - 150 536 Att Inc 66 625 25 567 44 577 19 921 - 17 372
NetIntPd(Rcvd) 457 - 505 - 40 826 - 78 154 938 TotCompIncLoss 66 625 25 567 44 756 19 922 - 17 372
Minority Int 378 1 822 1 765 1 747 3 773 Fixed Ass 189 868 160 270 136 617 102 748 124 271
Att Inc - 11 211 - 15 590 - 707 583 - 52 604 507 134 Inv & Loans - - - 4 740 2 000
TotCompIncLoss - 10 833 - 13 768 - 706 126 - 51 195 511 710 Tot Curr Ass 143 385 147 744 138 404 143 462 122 363
Fixed Ass 5 419 1 548 3 149 4 776 18 586 Ord SH Int 1 225 616 1 172 906 1 147 281 1 102 405 1 081 485
Inv & Loans 33 557 33 900 - - - LT Liab 102 940 104 322 132 731 132 081 133 392
Tot Curr Ass 338 260 324 284 148 961 147 339 248 124 Tot Curr Liab 129 709 151 138 121 992 117 497 103 598
Ord SH Int 477 437 487 928 496 934 1 204 755 1 264 108 PER SHARE STATISTICS (cents per share)
Minority Int 124 - 254 - 1 105 - 1 250 3 692 HEPS-C (ZARc) 25.71 9.66 17.67 6.09 - 7.97
LT Liab 78 496 50 365 50 490 285 698 273 629 NAV PS (ZARc) 488.14 460.89 450.82 433.19 424.97
Tot Curr Liab 42 296 37 785 36 108 117 963 174 881 3 Yr Beta - 0.20 0.66 1.39 1.35 0.40
Price High 120 149 275 174 200
PER SHARE STATISTICS (cents per share)
HEPS-C (ZARc) - 9.91 - 14.48 - 443.68 - 28.46 - 101.77 Price Low 67 75 102 23 49
DPS (ZARc) 25.00 - - - - Price Prd End 110 100 150 144 50
NAV PS (ZARc) 421.03 431.08 438.29 1 083.49 1 120.67 RATIOS 5.44 2.18 3.89 1.81 - 1.61
Ret on SH Fnd
3 Yr Beta 0.60 1.98 2.69 2.82 1.09
Price High 241 364 299 570 700 Oper Pft Mgn 6.86 5.00 4.36 3.23 - 0.63
Price Low 170 181 159 129 125 D:E 0.08 0.10 0.12 0.12 0.12
Price Prd End 201 239 240 255 140 Current Ratio 1.11 0.98 1.13 1.22 1.18
RATIOS
Ret on SH Fnd - 4.54 - 2.82 - 142.35 - 4.23 40.30
Oper Pft Mgn - 116.65 - 81.41 - 3 846.29 - 341.17 - 93.26
D:E 0.16 0.10 0.10 0.24 0.22
Current Ratio 8.00 8.58 4.13 1.25 1.42
Div Cover - 0.40 - - - -
190