
Page 187 - shbh24_complete
P. 187
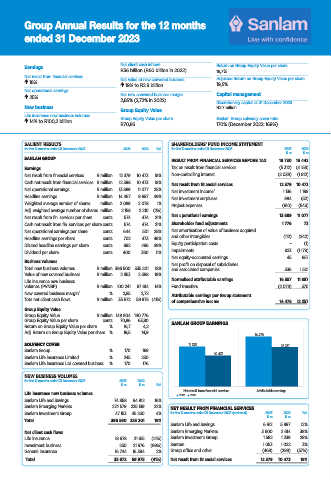
Group Annual Results for the 12 months
ended 31 December 2023
Earnings Net client cash inflows Return on Group Equity Value per share
R36 billion (R60 billion in 2022) 16,7%
Net result from financial services Adjusted Return on Group Equity Value per share
18% Net value of new convered business
19% to R2.9 billion 19,5%
Net operational earnings
25% Net new convered business margin Capital management
2,85% (2,72% in 2022) Discretionary capital at 31 December 2023
New business R2.7 billion
Group Equity Value
Life insurance new business volumes
14% to R100,2 billion Group Equity Value per share Sanlam Group solvency cover ratio
R70,86 170% (December 2022: 169%)
SALIENT RESULTS SHAREHOLDERS’ FUND INCOME STATEMENT
for the 12 months ended 31 December 2023 2023 2022 % for the 12 months ended 31 December 2023 2023 2022
R’m R’m
SANLAM GROUP
RESULT FROM FINANCIAL SERVICES BEFORE TAX 19 730 16 443
Earnings Tax on result from financial services (5 312) (4 158)
Net result from financial services R million 12 379 10 473 18% Non-controlling interest (2 039) (1 812)
Cash net result from financial services R million 12 398 10 473 18% Net result from financial services 12 379 10 473
Net operational earnings R million 13 889 11 077 25% Net investment income` 1 136 1 199
Headline earnings R million 14 467 9 687 49% Net investment surpluses 984 (52)
Weighted average number of shares million 2 089 2 078 1% Project expenses (610) (543)
Adj. weighted average number of shares million 2 158 2 210 (2%)
Net result from fin. services per share cents 574 474 21% Net operational earnings 13 889 11 077
Cash net result from fin. services per share cents 574 474 21% Shareholder fund adjustments 1 776 73
Net operational earnings per share cents 644 501 28% Net amortisation of value of business acquired
Headline earnings per share cents 702 473 48% and other intangibles (112) (242)
Diluted headline earnings per share cents 692 466 49% Equity participation costs – (1)
Dividend per share cents 400 360 11% Impairments 623 (1 178)
Net equity-accounted earnings 45 657
Business volumes Net profit on disposal of subsidiaries
Total new business volumes R million 396 500 335 201 18% and associated companies 336 1 501
Value of new covered business R million 2 853 2 388 19%
Life insurance new business Normalised attributable earnings 16 557 11 887
volumes (PVNBP) R million 100 241 87 814 14% Fund transfers (2 079) 370
New covered business margin` % 2,85 2,72 Attributable earnings per Group statement
Tota net client cash flows R million 35 672 59 975 (41%) of comprehensive income 14 478 12 257
Group Equity Value
Group Equity Value R million 149 904 140 776
Group Equity Value per share cents 70,86 63,80 SANLAM GROUP EARNINGS
Return on Group Equity Value per share % 16,7 4,2
Adj. Return on Group Equity Value per share % 19,5 14,9
14 478
SOLVENCY COVER 12 379 12 257
Sanlam Group % 170 169 10 473
Sanlam Life insurance Limited % 245 230
Sanlam Life Insurance Ltd covered business % 170 176
NEW BUSINESS VOLUMES
for the 12 months ended 31 December 2023 2023 2022
R’m R’m %
Net result from financial services Attributable earnings
Life insurance new business volumes 2023 2022
Sanlam Life and Savings 74 858 64 812 16%
Sanlam Emerging Markets 274 579 225 139 22% NET RESULT FROM FINANCIAL SERVICES
Sanlam Investment Group 47 153 45 250 4% for the 12 months ended 31 December 2023 (reviewed) 2023 2022 %
R’m R’m
Total 396 590 335 201 18%
Sanlam Life and Savings 6 612 5 897 12%
Net client cash fl ows Sanlam Emerging Markets 3 600 2 614 38%
Life insurance 18 678 21 615 (14%) Sanlam Investment Group 1 582 1 239 28%
Investment business 250 21 976 (99%) Santam 1 053 1 022 3%
General Insurance 16 744 16 384 2% Group office and other (468) (299) (57%)
Total 35 672 59 975 (41%) Net result from financial services 12 379 10 473 18%
29/04/2024 15:18:24
JSE R&E book AR2023 v20240429.indd 1 29/04/2024 15:18:24
JSE R&E book AR2023 v20240429.indd 1