
Page 193 - shbh24_complete
P. 193
Profile’s Stock Exchange Handbook: 2024 – Issue 3 JSE – SHA
Shaftesbury Capital plc Shoprite Holdings Ltd.
SHA SHO
ISIN: GB00B62G9D36 SHORT: SHBCAP CODE: SHC ISIN: ZAE000012084 SHORT: SHOPRIT CODE: SHP
REG NO: 2010/003387/10 FOUNDED: 2007 LISTED: 2010 REG NO: 1936/007721/06 FOUNDED: 1936 LISTED: 1936
NATURE OF BUSINESS: Shaftesbury Capital plc (“Shaftesbury Capital”) NATURE OF BUSINESS: Shoprite Holdings Ltd. (the Shoprite Group, or
is the leading central London mixed-use REIT and is a constituent of the the Group or the Company) is an investment-holding company
FTSE-250 Index. Our property portfolio, valued at GBP4.9 billion, extends headquartered inCapeTown,SouthAfrica. The Company’sprimarylisting
to 2.9 million square feet of lettable space across the most vibrant areas of is in the Food Retailers and Wholesalers’ Sector of the Johannesburg Stock
London’s West End. With a diverse mix of restaurants, cafés, bars, shops, Exchange(JSE).The Companyhastwosecondarylistingsonthe Namibian
residential and offices, our destinations include the high footfall, thriving Stock Exchange (NSX) and the Lusaka Stock Exchange (LuSE).
neighbourhoods of Covent Garden, Carnaby, Soho and Chinatown, SECTOR: CnsStp—PcDrugs&Groceries—PcDrugs&Groceries—Food
together with holdings in Fitzrovia. Our properties are close to the main NUMBER OF EMPLOYEES: 145 595
West End Underground stations and transport hubs for the Elizabeth Line. DIRECTORS: Cooper P (ind ne), de Beer PrfDr L (ind ne), Dempster G W
Shaftesbury Capital shares are listed on the London Stock Exchange and (ind ne), Gobodo N (ind ne), Marole M L D (ind ne), Maseko S N (ind ne),
the Johannesburg Stock Exchange. www.shaftesburycapital.com. Mathebula H (ind ne), Norman P (ind ne), Wiese Dr C H (ne),
SECTOR: RealEstate—RealEstate—REITS—Diversified Wiese Adv J D (alt), Wilton E (ind ne), Lucas-Bull W E (Chair, ind ne),
NUMBER OF EMPLOYEES: 70 Engelbrecht P C (CEO), de Bruyn A (CFO)
DIRECTORS: Akers R (snr ind ne), Anderson R (ne), Boyle C (ind ne), MAJOR ORDINARY SHAREHOLDERS as at 14 Jun 2024
Nicholls J (Chair, ne), Hawksworth I (CE), Jobanputra S (CFO) Government Employees Pension Fund 15.93%
MAJOR ORDINARY SHAREHOLDERS as at 02 Apr 2024 Wiese C H 10.67%
Norges Bank 23.53% Shoprite Checkers (Pty) Ltd. 7.42%
BlackRock Inc. 5.89% POSTAL ADDRESS: PO Box 215, Brackenfell, 7560
Public Investment Corporation SOC Ltd. 4.99% MORE INFO: www.sharedata.co.za/sdo/jse/SHP
MORE INFO: www.sharedata.co.za/sdo/jse/SHC COMPANY SECRETARY: P G du Preez
COMPANY SECRETARY: Ruth Pavey TRANSFER SECRETARY: Computershare Investor Services (Pty) Ltd.
TRANSFER SECRETARY: Computershare Investor Services (Pty) Ltd. SPONSOR: Nedbank Corporate and Investment Banking
SPONSOR: Java Capital Trustees and Sponsors (Pty) Ltd. AUDITORS: PwC Inc.
AUDITORS: PwC LLP
CAPITAL STRUCTURE AUTHORISED ISSUED
CAPITAL STRUCTURE AUTHORISED ISSUED SHP Ords no par 1 300 000 000 591 338 502
SHC Ords GBP25p ea - 1 953 178 138
DISTRIBUTIONS [ZARc]
DISTRIBUTIONS [GBPp] Ords no par Ldt Pay Amt
Ords GBP25p ea Ldt Pay Amt Interim No 150 25 Mar 24 2 Apr 24 267.00
Final No 26 23 Apr 24 31 May 24 1.65 Final No 149 26 Sep 23 2 Oct 23 415.00
Interim No 25 22 Aug 23 18 Sep 23 1.50
LIQUIDITY: Jul24 Avg 7m shares p.w., R1 747.3m(59.8% p.a.)
LIQUIDITY: Jul24 Avg 2m shares p.w., R44.9m(4.0% p.a.)
FOOR 40 Week MA SHOPRIT
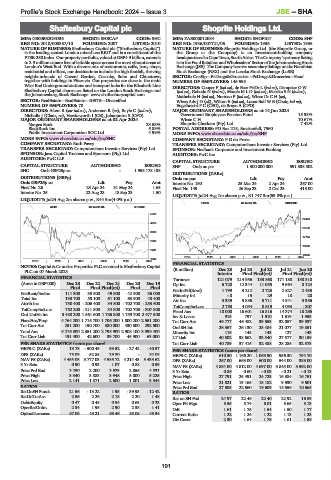
REIV 40 Week MA SHBCAP
5019
25450
4324
21599
3630
17749
2935
13898
2241
10048
2019 | 2020 | 2021 | 2022 | 2023 | 2024
1546
2019 | 2020 | 2021 | 2022 | 2023 | 2024
FINANCIAL STATISTICS
NOTES: Capital & Counties Properties PLC renamed to Shaftesbury Capital (R million) Dec 23 Jul 23 Jul 22 Jul 21 Jun 20
PLC on 07 March 2023.
Interim Final Final(rst) Final Final(rst)
FINANCIAL STATISTICS Turnover 121 079 214 956 183 868 171 188 158 310
(Amts in GBP’000) Dec 23 Dec 22 Dec 21 Dec 20 Dec 19 Op Inc 6 720 12 344 11 055 9 664 8 124
Final Final Final(rst) Final Final
NetRent/InvInc 111 300 33 500 49 500 42 900 36 000 NetIntPd(Rcvd) 1 799 3 212 2 723 2 827 2 435
Minority Int - 8 15 29 18 20
Total Inc 133 700 53 100 61 100 63 900 48 400 Att Inc 3 339 5 886 5 711 4 841 3 356
Attrib Inc 750 400 - 206 400 34 800 - 702 700 - 253 600 TotCompIncLoss 2 753 4 054 8 619 4 093 - 307
TotCompIncLoss 752 200 - 211 800 34 800 - 702 700 - 307 800 Fixed Ass 18 000 16 601 16 816 14 374 18 265
Ord UntHs Int 3 480 200 1 561 600 1 786 800 1 759 700 2 477 500 Inv & Loans 915 797 1 510 1 619 1 953
FixedAss/Prop 4 764 200 1 715 700 1 706 200 1 800 200 2 551 200 Tot Curr Ass 49 777 46 482 39 553 32 057 39 937
Tot Curr Ass 251 200 150 700 380 000 430 800 292 500 Ord SH Int 26 567 26 130 25 484 21 077 19 851
Total Ass 5 216 300 2 351 200 2 798 900 2 908 100 3 099 400 Minority Int 115 148 143 127 143
Tot Curr Liab 191 400 42 600 39 700 46 900 63 000
LT Liab 40 502 38 662 33 340 27 577 30 159
PER SHARE STATISTICS (cents per share) Tot Curr Liab 40 789 37 416 32 488 28 285 32 573
HEPS-C (ZARc) 13.78 - 500.45 93.52 - 27.42 - 40.57 PER SHARE STATISTICS (cents per share)
DPS (ZARc) 75.09 52.85 29.80 - 32.08 HEPS-C (ZARc) 610.50 1 166.20 1 063.90 956.30 794.70
NAV PS (ZARc) 4 455.05 3 777.03 4 585.72 4 214.43 5 433.62 DPS (ZARc) 267.00 663.00 600.00 544.00 383.00
3 Yr Beta 0.90 0.93 1.07 0.88 0.59 NAV PS (ZARc) 4 884.00 4 812.00 4 697.00 3 845.00 3 592.00
Price Prd End 3 250 2 200 3 623 2 856 4 831 3 Yr Beta 0.86 0.60 - 0.03 - 0.21 - 0.13
Price High 3 340 3 883 3 948 5 000 5 225 Price High 27 791 25 491 24 723 16 384 16 751
Price Low 2 141 1 871 2 600 1 801 3 344 Price Low 21 821 19 165 15 182 9 930 9 501
RATIOS Price Prd End 27 505 22 560 19 609 15 556 10 665
RetOnSH Funds 21.56 - 13.22 1.95 - 39.93 - 12.42 RATIOS
RetOnTotAss 2.56 2.26 2.18 2.20 1.48 Ret on SH Fnd 24.97 22.46 22.40 22.92 16.89
Debt:Equity 0.47 0.48 0.54 0.63 0.23 Oper Pft Mgn 5.55 5.74 6.01 5.65 5.13
OperRetOnInv 2.34 1.95 2.90 2.38 1.41 D:E 1.61 1.75 1.54 1.50 1.77
OpInc:Turnover 57.05 45.21 68.46 58.05 45.34
Current Ratio 1.22 1.24 1.22 1.13 1.23
Div Cover 2.30 1.64 1.75 1.61 1.58
191