
Page 153 - Profile's Stock Exchange Handbook - 2025 Issue 3
P. 153
Profile’s Stock Exchange Handbook: 2025 - Issue 3 JSE - NED
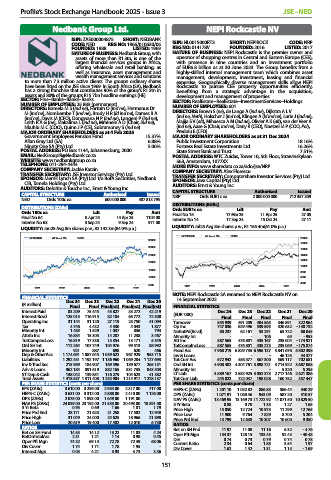
Nedbank Group Ltd. NEPI Rockcastle NV
ISIN: ZAE000004875 SHORT: NEDBANK
CODE: NED REG NO: 1966/010630/06 ISIN: NL0015000RT3 SHORT: NEPIROCK CODE: NRP
FOUNDED: 1888 LISTED: 1969 REG NO: 014178V FOUNDED: 2016 LISTED: 2017
NATURE OF BUSINESS: Nedbank Group, with NATURE OF BUSINESS: NEPI Rockcastle is the premier owner and
assets of more than R1.3tn, is one of the operator of shopping centres in Central and Eastern Europe (CEE),
largest financial services groups in Africa, with presence in nine countries and an investment portfolio
offering wholesale and retail banking, as of EUR6.8 billion as at 30 June 2023. The Group benefits from a
well as insurance, asset management and highly-skilled internal management team which combines asset
wealth management services and solutions management, development, investment, leasing and financial
to more than 7.3 million active clients. The group’s ordinary shares expertise. Geographically diverse management skills allow NEPI
have been listed on the JSE since 1969. In South Africa (SA), Nedbank Rockcastle to pursue CEE property opportunities efficiently,
has a strong franchise that contributes 90% of the group’s R1.3tn in benefiting from a strategic advantage in the acquisition,
assets and 80% of the group’s R15.7bn headline earnings (HE). development and management of properties.
SECTOR: Fins--Banks--Banks--Banks SECTOR: RealEstate--RealEstate--InvestmentServices--Holdings
NUMBER OF EMPLOYEES: 25 883 (permanent) NUMBER OF EMPLOYEES: 601
DIRECTORS: Bomela M S (ind ne), Fortuin O (ind ne), Hermanus Dr DIRECTORS: Brown S (ne), de Lange A (ind ne), Dijkstra A L V
M (ind ne), Nombembe T (ind ne), Brody H R (ld ind ne), Dames B A
(ind ne), Davis M (CFO), Dongwana N P (ind ne), Langeni P (ind ne), (ind ne, Neth), Holscher J (ind ne), Klingen A (ld ind ne), Lurie J (ind ne),
Leith R A G (ne), Makalima L (ind ne), Mminele A D (Chair, ind ne), Majija S V (alt), Mihaescu A M (ind ne), Olivier A K (alt), van der Veer A
Nkuhlu M C (COO), Quinn J P (CE), Subramoney S (ind ne) (ind ne), Aase G (Chair, ind ne), Dany R (CEO), Noetzel M P (COO, Pol),
MAJOR ORDINARY SHAREHOLDERS as at 4 Feb 2025 Predoiu E (CFO)
Government Employees Pension Fund 15.37% MAJOR ORDINARY SHAREHOLDERS as at 31 Dec 2024
Allan Gray Ltd (SA) 6.88% Public Investment Corporation 18.16%
Ninety One SA (Pty) Ltd. 5.00% Fortress Real Estate Investments Ltd. 16.26%
POSTAL ADDRESS: PO Box 1144, Johannesburg, 2000 State Street Bank and Trust 7.51%
EMAIL: NedGroupIR@Nedbank.co.za POSTAL ADDRESS: WTC Zuidas, Tower 10, 5th Floor, Strawinskylaan
WEBSITE: www.nedbankgroup.co.za 563, Amsterdam, 1077XX
TELEPHONE: 011-294-4444 MORE INFO: www.sharedata.co.za/sdo/jse/NRP
COMPANY SECRETARY: Jackie Katzin COMPANY SECRETARY: Alex Florescu
TRANSFER SECRETARY: JSE Investor Services (Pty) Ltd. TRANSFER SECRETARY: Computershare Investor Services (Pty) Ltd.
SPONSOR: Merrill Lynch SA (Pty) Ltd. t/a BofA Securities, Nedbank SPONSOR: Java Capital (Pty) Ltd.
CIB, Tamela Holdings (Pty) Ltd. AUDITORS: Ernst & Young Inc.
AUDITORS: Deloitte & Touche Inc., Ernst & Young Inc.
CAPITAL STRUCTURE Authorised Issued CAPITAL STRUCTURE Authorised Issued
NED Ords 100c ea 600 000 000 487 813 795 NRP Ords EUR1c ea 2 000 000 000 712 357 309
DISTRIBUTIONS [ZARc] DISTRIBUTIONS [EURc]
Ords 100c ea Ldt Pay Amt Ords EUR1c ea Ldt Pay Amt
Final No 64 8 Apr 25 14 Apr 25 1104.00 Final No 15 17 Mar 25 11 Apr 25 27.05
Interim No 63 3 Sep 24 9 Sep 24 971.00 Interim No 14 17 Sep 24 15 Oct 24 27.11
LIQUIDITY: Jun25 Avg 8m shares p.w., R2 142.3m(84.0% p.a.) LIQUIDITY: Jul25 Avg 8m shares p.w., R1 155.4m(61.0% p.a.)
NEPIROCK 40 Week MA REDS
NEDBANK 40 Week MA BANK 20000
35000
18000
30000
16000
25000 14000
12000
20000
10000
15000
8000
10000 6000
4000
5000 2021 2022 2023 2024 2025
2021 2022 2023 2024 2025
NOTE: NEPI Rockcastle SA renamed to NEPI Rockcastle NV on
FINANCIAL STATISTICS 14 September 2022
(R million) Dec 24 Dec 23 Dec 22 Dec 21 Dec 20
Final Final Final(rst) Final(rst) Final(rst) FINANCIAL STATISTICS
Interest Paid 83 209 75 445 45 827 33 272 42 219 (EUR ’000) Dec 24 Dec 23 Dec 22 Dec 21 Dec 20
Interest Rcvd 125 015 116 915 82 104 65 772 72 300 Final Final Final Final Final
Operating Inc 31 144 31 120 27 119 23 750 41 094 Turnover 555 939 491 209 404 565 346 891 322 964
Tax 4 746 4 432 4 330 4 043 1 877 Op Inc 747 036 629 496 539 895 320 632 - 130 732
Minority Int 1 485 1 529 1 037 836 794 NetIntPd(Rcvd) 80 237 62 161 53 291 65 722 60 045
Attrib Inc 16 834 15 305 14 287 11 238 3 467 Minority Int - - 106 65 - 953
TotCompIncLoss 16 819 17 338 13 354 13 171 5 345 Att Inc 587 565 476 801 435 167 235 004 - 174 921
Ord SH Int 112 264 107 749 104 976 99 513 88 992 TotCompIncLoss 587 565 476 801 435 273 235 069 - 175 874
Minority Int 921 887 698 620 466 Fixed Ass 7 968 219 6 829 735 6 596 137 5 841 676 5 802 398
Dep & OtherAcc 1 174 691 1 087 645 1 039 622 967 929 953 715 Inv & Loans - - - 46 125 44 377
Liabilities 1 292 451 1 192 197 1 136 960 1 069 284 1 127 693 Tot Curr Ass 572 942 458 577 367 300 569 117 702 681
Inv & Trad Sec 215 989 184 907 169 596 189 677 265 151 Ord SH Int 4 908 482 4 304 761 3 898 721 3 714 922 3 687 068
Adv & Loans 962 184 891 619 882 165 831 735 843 303 Minority Int - - - 5 320 5 255
ST Dep & Cash 138 042 139 851 116 279 104 623 41 382 LT Liab 3 589 167 2 582 925 3 052 373 2 717 146 2 621 386
Total Assets 1 418 537 1 311 408 1 252 904 1 214 917 1 228 137 Tot Curr Liab 245 022 722 037 198 028 160 752 357 447
PER SHARE STATISTICS (cents per share) PER SHARE STATISTICS (cents per share)
EPS (ZARc) 3 610.00 3 239.00 2 934.00 2 317.00 717.00 HEPS-C (ZARc) 1 201.10 1 052.82 886.83 586.44 340.29
HEPS-C (ZARc) 3 631.00 3 312.00 2 888.00 2 410.00 1 126.00 DPS (ZARc) 1 071.91 1 060.46 943.09 587.20 310.57
DPS (ZARc) 2 075.00 1 893.00 1 649.00 1 191.00 - NAV PS (ZARc) 13 469.95 13 169.73 11 722.92 11 071.50 10 829.50
NAV PS (ZARc) 24 039.00 23 192.00 21 533.00 20 493.00 18 391.00 3 Yr Beta 0.88 0.70 1.35 1.27 1.65
3 Yr Beta 0.95 0.69 1.66 1.81 1.79 Price High 15 050 12 724 10 975 11 299 12 765
Price Prd End 28 171 21 623 21 258 17 502 12 948 Price Low 11 900 9 764 7 829 8 700 5 204
Price High 31 049 24 000 24 625 18 966 21 898 Price Prd End 13 799 12 638 10 307 10 600 9 350
Price Low 20 619 19 400 17 482 12 010 6 730 RATIOS
RATIOS
11.16
6.32
11.08
- 4.76
11.97
Ret on SH Fund 14.53 14.12 13.22 11.03 4.24 Ret on SH Fnd 134.37 128.15 133.45 92.43 - 40.48
Oper Pft Mgn
RetOnTotalAss 2.31 1.21 1.14 0.98 0.45 D:E 0.74 0.73 0.79 0.74 0.78
Oper Pft Mgn 74.32 69.14 72.78 72.49 68.06 Current Ratio 2.34 0.64 1.85 3.54 1.97
Div Cover 1.74 1.71 1.78 1.95 - Div Cover 1.62 1.42 1.31 1.15 - 1.69
Interest Mgn 0.03 4.21 3.93 3.73 3.36
151