
Page 152 - Profile's Stock Exchange Handbook - 2025 Issue 3
P. 152
JSE - NAM Profile’s Stock Exchange Handbook: 2025 - Issue 3
Nampak Ltd. Naspers Ltd.
ISIN: ZAE000322095 SHORT: NAMPAK CODE: NPK ISIN: ZAE000325783 SHORT: NASPERS-N CODE: NPN
ISIN: ZAE000004958 SHORT: NAMPAK 6%P CODE: NPKP REG NO: 1925/001431/06 FOUNDED: 1925 LISTED: 1994
ISIN: ZAE000004966 SHORT: NAMPAK 6.5 CODE: NPP1 NATURE OF BUSINESS: Established in 1915, Naspers has
REG NO: 1968/008070/06 FOUNDED: 1968 LISTED: 1969 transformed itself to become a global consumer internet company
NATURE OF BUSINESS: Nampak is Africa’s leading diversified and one of the largest technology investors in the world. Through
packaging manufacturer, and has been listed on the JSE since Prosus, the group operates and invests globally in markets with
1969. Nampak operates from 19 sites in South Africa, contributing long-term growth potential, building leading consumer internet
approximately 68% to group revenue, 14 sites in the rest of Africa, companies that empower people and enrich communities. Prosus
contributing 32% to group revenue. has its primary listing on Euronext Amsterdam, and a secondary
SECTOR: Inds--IndsGoods&Services--GeneralIndustr--Cont&Pckgng listing on the Johannesburg Stock Exchange and Naspers is the
NUMBER OF EMPLOYEES: 2 463 majority owner of Prosus.
DIRECTORS: Mnisi P J (ind ne), Mzondeki K (ind ne), Ridley S (ind ne), SECTOR: Technology--Technology--Software & CompSer--DigitalService
Siyotula N (ind ne), van der Veen A (Chair, ind ne), Roux P M (CEO), NUMBER OF EMPLOYEES: 33 246
Fullerton G (CFO), Hood A (COO) DIRECTORS: Dubey S (ind ne), Kemna A (ind ne), Mahanyele-Dabengwa
MAJOR ORDINARY SHAREHOLDERS as at 13 Nov 2024 P, Bloisi F (CEO), Marais N (CFO), Bekker J P (Chair, ne),
PSG Asset Management 11.11% du Toit H J (ld ind ne), Enenstein C (ind ne), Girotra M (ind ne, Indian),
Allan Gray 10.43% Jafta Prof R C C (ind ne), Letele F L N (ind ne), Meyer Prof D (ind ne),
M&G Investment Management (Pty) Ltd. 10.23% Oliveira de Lima R (ind ne), Pacak S J Z (ind ne), Sorour M R (ne),
POSTAL ADDRESS: PO Box 69983, Bryanston, 2021 Stofberg J D T (Alternate, ind ne), Xu Y (ind ne, China)
MORE INFO: www.sharedata.co.za/sdo/jse/NPK MAJOR ORDINARY SHAREHOLDERS as at 31 Mar 2025
COMPANY SECRETARY: Omeshnee Pillay Public Investment Corporation Group 23.38%
TRANSFER SECRETARY: Computershare Investor Services (Pty) Ltd. POSTAL ADDRESS: PO Box 2271, Cape Town, 8000
SPONSOR: PSG Capital (Pty) Ltd. MORE INFO: www.sharedata.co.za/sdo/jse/NPN
AUDITORS: PwC Inc. COMPANY SECRETARY: Lynelle Bagwandeen
CAPITAL STRUCTURE Authorised Issued TRANSFER SECRETARY: JSE Investor Services (Pty) Ltd.
NPK Ords no par val 600 000 000 8 476 184 SPONSOR: Investec Bank Ltd.
NPKP Prefs 200c ea 400 000 400 000 AUDITORS: Deloitte & Touche Inc.
NPP1 Prefs 200c ea 100 000 100 000 CAPITAL STRUCTURE Authorised Issued
NPN N Ords no par value 500 000 000 164 431 276
DISTRIBUTIONS [ZARc]
Ords no par val Ldt Pay Amt DISTRIBUTIONS [ZARc]
Final No 87 8 Jan 16 18 Jan 16 23000.00 N Ords 2c ea Ldt Pay Amt
Interim No 86 26 Jun 15 6 Jul 15 10500.00 Final No 95 3 Dec 24 9 Dec 24 1205.00
LIQUIDITY: Jul25 Avg 71 675 shares p.w., R31.1m(44.0% p.a.) Final No 94 5 Dec 23 11 Dec 23 874.00
LIQUIDITY: Jul25 Avg 2m shares p.w., R10 117.8m(73.3% p.a.)
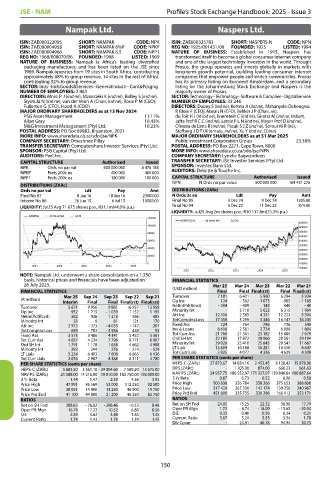
NAMPAK 40 Week MA GENI
120000
NASPERS-N 40 Week MA SCOM
600000
100000
550000
80000 500000
450000
60000 400000
350000
40000
300000
20000 250000
200000
0 150000
2021 2022 2023 2024 2025
100000
2021 2022 2023 2024 2025
NOTE: Nampak Ltd. underwent a share consolidation on a 1:250
basis, historical prices and financials have been adjusted on FINANCIAL STATISTICS
26 July 2023. Mar 25 Mar 24 Mar 23 Mar 22 Mar 21
FINANCIAL STATISTICS (USD million) Final Final Final(rst) Final Final(rst)
5 934
5 960
(R million) Mar 25 Sep 24 Sep 23 Sep 22 Sep 21 Turnover 7 181 6 431 - 1 073 6 294 - 1 189
- 985
Op Inc
124
- 562
Interim Final Final Final(rst) Final(rst)
Turnover 5 671 9 956 9 881 16 937 13 958 NetIntPd(Rcvd) - 394 - 409 143 440 - 40
Op Inc 952 1 715 - 1 039 1 152 1 195 Minority Int - 3 710 5 623 6 315 1 964
NetIntPd(Rcvd) 282 926 1 218 586 485 Att Inc 12 316 2 585 4 331 12 223 5 304
Minority Int 33 - 9 81 121 170 TotCompIncLoss 17 450 3 259 5 346 16 147 16 241
Att Inc 2 973 - 373 - 4 033 - 147 207 Fixed Ass 724 764 786 736 545
TotCompIncLoss 659 - 702 - 3 936 438 93 Inv & Loans 6 616 2 581 2 734 6 008 1 804
Fixed Ass 3 573 3 486 4 341 5 452 5 361 Tot Curr Ass 21 760 21 361 23 182 15 485 7 679
Tot Curr Ass 4 657 4 234 7 796 8 771 6 907 Ord SH Int 22 185 17 872 18 960 20 581 29 194
Ord SH Int 1 791 1 178 1 638 4 662 4 988 Minority Int 29 026 23 410 25 645 29 547 11 667
Minority Int 292 244 276 214 - 529 LT Liab 15 609 16 188 16 281 16 550 8 647
LT Liab 5 234 6 403 7 608 6 665 6 436 Tot Curr Liab 5 925 4 077 4 336 4 639 4 309
Tot Curr Liab 2 676 2 967 4 388 6 311 4 780 PER SHARE STATISTICS (cents per share)
PER SHARE STATISTICS (cents per share) HEPS-C (ZARc) 27 873.67 14 834.16 2 452.45 8 128.42 15 878.90
HEPS-C (ZARc) 5 683.50 3 361.10 - 39 004.60 7 589.20 15 575.00 DPS (ZARc) - 1 205.00 874.00 660.23 661.63
NAV PS (ZARc) 21 588.00 14 216.00 19 810.00 183 750.00 193 000.00 NAV PS (ZARc) 24 957.75 186 552.97 171 327.07 139 846.84 100 887.64
3 Yr Beta 1.44 1.47 2.39 4.36 3.95 3 Yr Beta 0.87 0.73 0.52 0.36 0.58
Price High 47 991 45 569 53 000 112 250 92 500 Price High 500 838 356 784 358 266 375 653 388 800
Price Low 38 051 14 800 13 250 46 000 19 750 Price Low 317 429 267 330 142 174 139 250 240 967
Price Prd End 41 100 44 800 21 200 46 250 83 750 Price Prd End 451 800 335 755 329 296 166 412 353 171
RATIOS RATIOS
Ret on SH Fnd 288.63 - 26.82 - 206.46 - 0.53 8.46 Ret on SH Fnd 24.05 15.25 22.32 36.98 17.79
Oper Pft Mgn 16.78 17.22 - 10.52 6.80 8.56 Oper Pft Mgn 1.73 - 8.74 - 18.00 - 15.65 - 20.04
D:E 2.59 4.62 4.46 1.85 1.45 D:E 0.33 0.40 0.38 0.34 0.21
Current Ratio 1.74 1.43 1.78 1.39 1.45 Current Ratio 3.67 5.24 5.35 3.34 1.78
Div Cover - 23.81 40.78 94.94 30.75
150