
Page 155 - Profile's Stock Exchange Handbook - 2025 Issue 3
P. 155
Profile’s Stock Exchange Handbook: 2025 - Issue 3 JSE - NIC
Nictus Ltd. Ninety One Ltd.
ISIN: NA0009123481 SHORT: NICTUS CODE: NCS ISIN: ZAE000282356 SHORT: NINETY 1L CODE: NY1
REG NO: 1981/011858/06 FOUNDED: 1964 LISTED: 1969 REG NO: 2019/526481/06 FOUNDED: 2019 LISTED: 2020
NATURE OF BUSINESS: Nictus is an investment holding company, NATURE OF BUSINESS: Ninety One is an independent investment
which owns a non-life insurer through the Corporate Guarantee manager, founded in South Africa in 1991. It operates and invests
brand as well as retailer of household furniture, electrical globally and offers a range of active strategies to its global client
appliances and home electronics sold through the Nictus brand. base. Ninety One is listed on the London and Johannesburg Stock
Nictus’ ideal future is to become a sought-after wealth creator for Exchanges.
all stakeholders involved and has set its strategies and action plans SECTOR: Fins--FinServcs--InvBnkng&BrokerServcs--AssMgrs&Custodians
accordingly. NUMBER OF EMPLOYEES: 1 230
SECTOR: ConsDiscr--Retail--Retailers--DiversifiedRetailers DIRECTORS: Aranda I F B (ind ne, Esp), Cochrane V S (ind ne, UK),
NUMBER OF EMPLOYEES: 42 Keogh C D (snr ind ne, UK), Mabuza B A (ind ne), Shuenyane K L (ne),
DIRECTORS: de Vrye C J (ind ne), Martin S (ind ne), Tromp P J de W (ne), Penny G P H (Chair, ind ne, UK), du Toit H J (CEO),
Willemse Prof B J (Chair, ind ne), Tromp G R de V (Group MD), McFarland K (FD, UK)
Prozesky H E (FD) MAJOR ORDINARY SHAREHOLDERS as at 7 May 2025
MAJOR ORDINARY SHAREHOLDERS as at 31 Mar 2025 Forty Two Point Two 17.07%
Landswyd Beleggings (Pty) Ltd. 47.41% Allan Gray 15.30%
Namprop (Pty) Ltd. 11.76% Public Investment Corporation 14.86%
Trocor (Pty) Ltd. 11.17% POSTAL ADDRESS: 36 Hans Strijdom Avenue, Foreshore, Cape Town,
POSTAL ADDRESS: PO Box 2878, Randburg, 2125 8001
MORE INFO: www.sharedata.co.za/sdo/jse/NCS MORE INFO: www.sharedata.co.za/sdo/jse/NY1
COMPANY SECRETARY: Veritas Eksekuteurskamer (Pty) Ltd. COMPANY SECRETARY: Ninety One Africa (Pty) Ltd.
TRANSFER SECRETARY: Computershare Investor Services (Pty) Ltd. TRANSFER SECRETARY: Computershare Investor Services (Pty) Ltd.
SPONSOR: One Capital Sponsor Services (Pty) Ltd. SPONSOR: JP Morgan Equities South Africa (Pty) Ltd.
AUDITORS: PwC Inc. AUDITORS: PwC Inc.
CAPITAL STRUCTURE Authorised Issued CAPITAL STRUCTURE Authorised Issued
NCS Ords no par value 250 000 000 53 443 500 NY1 Ords no par value - 268 370 594
DISTRIBUTIONS [ZARc] DISTRIBUTIONS [ZARc]
Ords no par value Ldt Pay Amt Ords no par val. Ldt Pay Amt
Final No 42 15 Jul 25 21 Jul 25 12.00 Final No 10 15 Jul 25 7 Aug 25 164.00
Final No 41 16 Jul 24 22 Jul 24 6.00 Interim No 9 10 Dec 24 31 Dec 24 123.00
LIQUIDITY: Jul25 Avg 15 906 shares p.w., R22 300.4(1.5% p.a.) LIQUIDITY: Jul25 Avg 4m shares p.w., R140.4m(72.9% p.a.)
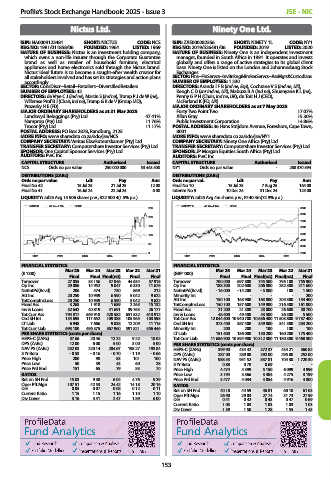
NICTUS 40 Week MA GERE NINETY 1L 40 Week MA GENF
250 9000
8000
200
7000
150
6000
5000
100
4000
50
3000
0 2000
2021 2022 2023 2024 2025 2021 2022 2023 2024 2025
FINANCIAL STATISTICS FINANCIAL STATISTICS
Mar 25 Mar 24 Mar 23 Mar 22 Mar 21 Mar 25 Mar 24 Mar 23 Mar 22 Mar 21
(R ’000) (GBP ’000)
Final Final Final(rst) Final Final Final Final Final(rst) Final(rst) Final
Turnover 27 055 35 156 37 046 44 634 57 915 Turnover 700 000 697 800 745 500 795 100 755 900
Op Inc 29 086 14 952 9 047 6 330 11 676 Op Inc 188 300 202 600 206 800 252 300 211 600
NetIntPd(Rcvd) 206 474 730 869 212 NetIntPd(Rcvd) - 16 000 - 14 200 - 5 800 100 1 500
Att Inc 20 250 10 939 6 590 5 042 9 622 Minority Int - - - - 200
TotCompIncLoss 20 250 10 939 6 590 5 042 9 622 Att Inc 150 100 163 900 163 800 205 300 154 400
Fixed Ass 3 268 1 918 1 689 2 265 15 132 TotCompIncLoss 150 100 157 600 149 900 216 500 161 000
Inv & Loans 32 642 40 819 41 691 39 763 26 177 Fixed Ass 21 200 21 300 23 000 26 600 30 700
Tot Curr Ass 794 817 569 918 428 582 651 532 613 912 Inv & Loans 48 600 49 400 43 500 36 300 5 500
Ord SH Int 134 695 117 652 109 385 105 965 103 595 Tot Curr Ass 12 044 600 10 940 700 10 636 400 11 503 800 9 737 400
LT Liab 6 948 7 666 9 038 12 209 11 115 Ord SH Int 373 400 367 400 349 800 341 500 253 200
Tot Curr Liab 693 180 496 375 367 960 591 821 556 446 Minority Int 200 200 100 100 100
PER SHARE STATISTICS (cents per share) LT Liab 151 600 156 000 150 200 160 200 175 400
HEPS-C (ZARc) 37.66 20.46 12.22 9.22 18.02 Tot Curr Liab 11 686 900 10 594 900 10 312 300 11 180 300 9 468 300
DPS (ZARc) 12.00 6.00 5.00 3.00 5.00 PER SHARE STATISTICS (cents per share)
NAV PS (ZARc) 252.03 220.14 204.67 198.27 193.84 HEPS-C (ZARc) 399.90 434.42 372.37 434.21 360.82
3 Yr Beta - 0.53 - 0.16 - 0.70 - 1.19 - 0.66 DPS (ZARc) 287.00 289.00 292.00 295.00 252.00
Price High 200 98 83 101 100 NAV PS (ZARc) 988.53 951.52 837.81 704.30 1 720.30
Price Low 50 39 43 60 28 3 Yr Beta 0.88 0.78 0.69 - -
Price Prd End 151 65 79 83 70 Price High 4 474 4 399 5 150 6 099 4 995
RATIOS Price Low 3 194 3 566 3 484 4 275 3 199
Ret on SH Fnd 15.03 9.30 6.02 4.76 9.29 Price Prd End 3 477 4 034 4 054 4 916 4 800
Oper Pft Mgn 107.51 42.53 24.42 14.18 20.16 RATIOS
D:E 0.05 0.07 0.08 0.12 0.11 Ret on SH Fnd 40.18 44.59 46.81 60.10 61.03
Current Ratio 1.15 1.15 1.16 1.10 1.10 Oper Pft Mgn 26.90 29.03 27.74 31.73 27.99
Div Cover 3.16 3.41 2.47 1.89 6.00 D:E 0.41 0.42 0.43 0.47 0.69
Current Ratio 1.03 1.03 1.03 1.03 1.03
Div Cover 1.39 1.50 1.28 1.55 1.43
153