
Page 149 - Profile's Stock Exchange Handbook - 2025 Issue 3
P. 149
Profile’s Stock Exchange Handbook: 2025 - Issue 3 JSE - MPA
Mpact Ltd. Mr Price Group Ltd.
ISIN: ZAE000156501 SHORT: MPACT CODE: MPT ISIN: ZAE000200457 SHORT: MRPRICE CODE: MRP
REG NO: 2004/025229/06 FOUNDED: 2004 LISTED: 2011 REG NO: 1933/004418/06 FOUNDED: 1885 LISTED: 1952
NATURE OF BUSINESS: Mpact is the largest paper and plastics NATURE OF BUSINESS: Mr Price Group Ltd. is a cash-based, omni-
packaging and recycling business in Southern Africa with customers channel, fashion-value retailer targeting a wide range of customers
that include packaging converters, fruit producers and FMCG in the mid to upper LSM categories, retailing own-branded
companies. Mpact’s integrated business model is uniquely focused merchandise, every Day Low Prices and predominantly trading in
on closing the loop in plastic and paper packaging through recycling South Africa.
and beneficiation of recyclables. SECTOR: ConsDiscr--Retail--Retailers--ApparelRetailers
SECTOR: Inds--IndsGoods&Services--GeneralIndustr--Cont&Pckgng NUMBER OF EMPLOYEES: 28 862
NUMBER OF EMPLOYEES: 4 557 DIRECTORS: Abrams N (ind ne), Bowman M (ld ind ne), Canny J (ind ne),
DIRECTORS: Conrad A (ind ne), Futwa F (ind ne), Makanjee M (ind ne), Inskip R J D (ind ne), Naidoo D (ind ne), Nkabinde R (ind ne), Ramsumer
Mayet S (ind ne), Wilson D G (ind ne), Luthuli P C S (Chair, ld ind ne), H (ind ne), Swartz L (ind ne), Payne N G (Chair, ind ne), Blair M M (CEO),
Strong B W (CEO), Snyman J J (CFO) Cohen S B (Honorary Chair, ne), Nundkumar P (CFO)
MAJOR ORDINARY SHAREHOLDERS as at 31 Dec 2024 MAJOR ORDINARY SHAREHOLDERS as at 5 Mar 2025
Caxton and CTP Publishers and Printers Ltd. 33.66% Public Investment Corporation Group 16.86%
Gayatri Paper Mills Gauteng (Pty) Ltd. 10.70% Ninety One SA (Pty) Ltd. 10.06%
Old Mutual Group 6.44% JP Morgan 5.58%
POSTAL ADDRESS: 4th Floor, 3 Melrose Arch Boulevard, Melrose Arch, POSTAL ADDRESS: PO Box 912, Durban, 4000
Johannesburg, 2196 MORE INFO: www.sharedata.co.za/sdo/jse/MRP
MORE INFO: www.sharedata.co.za/sdo/jse/MPT COMPANY SECRETARY: Janis Peta Cheadle
COMPANY SECRETARY: Donna Dickson TRANSFER SECRETARY: Computershare Investor Services (Pty) Ltd.
TRANSFER SECRETARY: JSE Investor Services (Pty) Ltd. SPONSOR: Investec Bank Ltd.
SPONSOR: The Standard Bank of South Africa Ltd. AUDITORS: Deloitte & Touche Inc.
AUDITORS: PwC Inc. CAPITAL STRUCTURE Authorised Issued
CAPITAL STRUCTURE Authorised Issued MRP Ords 0.025c ea 323 300 000 259 792 408
MPT Ords no par value 217 500 000 149 453 688 DISTRIBUTIONS [ZARc]
DISTRIBUTIONS [ZARc] Ords 0.025c ea Ldt Pay Amt
Ords no par value Ldt Pay Amt Final No 68 1 Jul 25 7 Jul 25 593.50
Final No 24 8 Apr 25 14 Apr 25 75.00 Interim No 67 10 Dec 24 17 Dec 24 303.60
Interim No 23 27 Aug 24 2 Sep 24 30.00 LIQUIDITY: Jul25 Avg 6m shares p.w., R1 487.1m(122.8% p.a.)
LIQUIDITY: Jul25 Avg 180 132 shares p.w., R5.2m(6.3% p.a.)
MRPRICE 40 Week MA GERE
35000
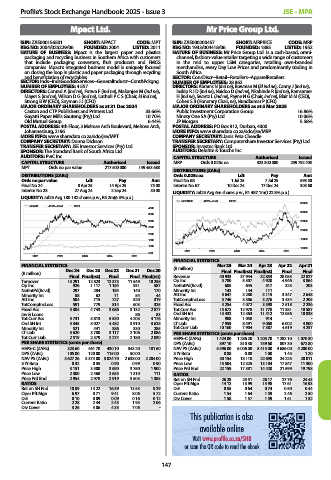
MPACT 40 Week MA GENI
4000
30000
3500
3000 25000
2500
20000
2000
1500 15000
1000 10000
2021 2022 2023 2024 2025
500
2021 2022 2023 2024 2025
FINANCIAL STATISTICS
FINANCIAL STATISTICS Mar 25 Mar 24 Apr 23 Apr 22 Apr 21
Dec 24 Dec 23 Dec 22 Dec 21 Dec 20 (R million) Final Final(rst) Final(rst) Final Final
(R million)
Final Final(rst) Final Final Final(rst) Revenue 40 933 37 944 32 853 28 083 22 827
Turnover 13 291 12 823 12 373 11 549 10 258 Op Inc 5 780 5 307 4 920 4 946 3 864
Op Inc 926 1 117 1 164 931 587 NetIntPd(Rcvd) 605 645 517 323 203
NetIntPd(Rcvd) 297 284 184 140 170 Minority Int 142 144 111 - -
Minority Int 88 62 71 54 44 Att Inc 3 647 3 280 3 115 3 347 2 648
Att Inc 504 715 727 520 319 TotCompIncLoss 3 746 3 386 3 276 3 434 2 205
TotCompIncLoss 591 779 814 603 325 Fixed Ass 4 254 4 072 3 598 2 518 2 236
Fixed Ass 5 304 4 743 3 686 3 132 2 877 Tot Curr Ass 15 672 12 978 11 778 11 381 10 587
Inv & Loans - - - 86 83 Ord SH Int 13 432 12 363 11 412 12 056 10 838
Tot Curr Ass 5 731 5 813 5 530 4 203 4 176 Minority Int 988 1 058 914 - -
Ord SH Int 5 345 5 027 4 482 3 910 3 628 LT Liab 7 959 8 491 9 068 6 002 4 800
Minority Int 521 441 386 330 285 Tot Curr Liab 10 160 7 904 7 387 4 619 4 237
LT Liab 3 620 3 780 3 117 2 106 2 086 PER SHARE STATISTICS (cents per share)
Tot Curr Liab 2 519 2 379 2 274 2 180 2 030 HEPS-C (ZARc) 1 424.00 1 286.20 1 205.70 1 282.10 1 070.30
PER SHARE STATISTICS (cents per share) DPS (ZARc) 897.10 810.30 759.60 807.30 672.80
HEPS-C (ZARc) 323.60 461.70 430.10 343.20 181.60 NAV PS (ZARc) 5 596.00 6 006.00 5 415.00 4 686.00 4 200.00
DPS (ZARc) 105.00 120.00 115.00 50.00 - 3 Yr Beta 0.88 0.88 1.00 1.45 1.20
NAV PS (ZARc) 3 627.26 3 374.00 3 024.70 2 638.00 2 204.00 Price High 30 154 18 118 22 698 24 225 20 011
3 Yr Beta 0.32 0.35 0.90 0.99 0.90 Price Low 15 504 12 325 13 104 17 847 11 300
Price High 3 151 3 500 3 690 3 750 1 900 Price Prd End 22 159 17 381 14 420 21 599 19 798
Price Low 2 300 2 460 2 635 1 310 111 RATIOS
Price Prd End 2 954 2 978 2 919 3 503 1 385 Ret on SH Fnd 26.28 25.51 26.17 27.76 24.43
RATIOS Oper Pft Mgn 14.12 13.99 14.98 17.61 16.93
Ret on SH Fnd 10.09 14.22 16.39 13.53 9.29 D:E 0.55 0.64 0.74 0.50 0.44
Oper Pft Mgn 6.97 8.71 9.41 8.06 5.72 Current Ratio 1.54 1.64 1.59 2.46 2.50
D:E 0.10 0.09 0.09 0.16 0.12 Div Cover 1.58 1.57 1.59 1.61 1.52
Current Ratio 2.28 2.44 2.43 1.93 2.06
Div Cover 3.26 4.06 4.35 7.06 -
This publication is also
available online
Visit www.profile.co.za/SHB
or scan the QR code to read the ebook
147