
Page 142 - Profile's Stock Exchange Handbook - 2025 Issue 3
P. 142
JSE - MAN Profile’s Stock Exchange Handbook: 2025 - Issue 3
Mantengu Mining Ltd. Marshall Monteagle plc
ISIN: ZAE000320347 SHORT: MANTENGU CODE: MTU ISIN: JE00B5N88T08 SHORT: MARSHALL CODE: MMP
REG NO: 1987/004821/06 FOUNDED: 1987 LISTED: 1988 REG NO: 102785 FOUNDED: 2010 LISTED: 2011
NATURE OF BUSINESS: Mantengu is a resource investment company NATURE OF BUSINESS: Marshall Monteagle plc (“the Company”) is
which is focused on unlocking new value in the mining, mining an Investment Company listed on the JSE, which holds a wide and
services and energy sectors. Mantengu intends to be a “Next diversified range of investments. The Company and its subsidiaries
Generation” conglomerate because it’s funding, empowerment (collectively referred to as “the Group“) is a multinational enterprise
and business models transcend the typical extractive models by that as well as having investments in listed equities and industrial
creating and introducing new growth into financially unchartered and commercial properties, provides procurement, logistics
parts of South Africa. and trading in various hard and soft commodities, industrial raw
SECTOR: Inds--IndsGoods&Services--IndsEng--Machinery: Industrial materials, consumer food and non-food products.
NUMBER OF EMPLOYEES: 0 SECTOR: Inds--IndsGoods&Services--IndsSupptServ--Industrial Supplies
DIRECTORS: Collins A, Geyer W (ind ne), Madlela V (ld ind ne), NUMBER OF EMPLOYEES: 0
Tshikundamalema J (Chair, ind ne), Miller M J (CEO), Naidoo M (CFO) DIRECTORS: Douglas D (ne), Jankovich-Besan J (ne), Stewart M E (ne),
MAJOR ORDINARY SHAREHOLDERS as at 28 Feb 2025 Kerr R C (Chair, ne), Marshall W (CEO), Beale E (Group FD)
The Gamsy Family Trust 11.88% MAJOR ORDINARY SHAREHOLDERS as at 31 Mar 2025
Asure Investments (Pty) Ltd. 8.84% Lynchwood Nominees 66.90%
Disruption Capital (Pty) Ltd. 8.20% Corwil Investments Holdings (Pty) Ltd. 5.70%
POSTAL ADDRESS: Postnet Suite 446, Private Bag X21, Bryanston, 2021 POSTAL ADDRESS: PO Box 4126, The Square, Umhlanga, 4021
MORE INFO: www.sharedata.co.za/sdo/jse/MTU MORE INFO: www.sharedata.co.za/sdo/jse/MMP
COMPANY SECRETARY: Neil Esterhuysen & Associates Inc. COMPANY SECRETARY: Melissa Bourgeois
TRANSFER SECRETARY: Computershare Investor Services (Pty) Ltd. TRANSFER SECRETARY: Computershare Investor Services (Pty) Ltd.
AUDITORS: HLB CMA (South Africa) Inc. SPONSOR: Questco Corporate Advisory (Pty) Ltd.
CAPITAL STRUCTURE Authorised Issued AUDITORS: Grant Thornton
MTU Ords no par value - 317 732 250 CAPITAL STRUCTURE Authorised Issued
DISTRIBUTIONS [ZARc] MMP Ords USD25c ea 40 000 000 35 857 512
Ords no par value Ldt Pay Amt DISTRIBUTIONS [USDc]
Final No 9 3 Oct 03 13 Oct 03 100.00 Ords USD25c ea Ldt Pay Amt
Final 14 Aug 98 29 Aug 98 300.00 Final No 30 15 Jul 25 1 Aug 25 2.00
LIQUIDITY: Jul25 Avg 4m shares p.w., R2.6m(59.0% p.a.) Interim No 29 7 Jan 25 24 Jan 25 2.00
LIQUIDITY: Jul25 Avg 14 769 shares p.w., R418 433.5(2.1% p.a.)
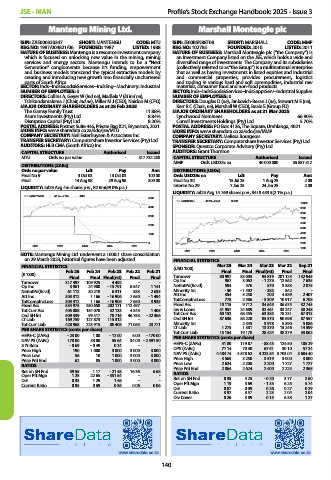
MANTENGU 40 Week MA IIND
5000
MARSHALL 40 Week MA SUPS
10000
4000 9000
8000
3000
7000
6000
2000
5000
1000 4000
3000
0 2000
2021 2022 2023 2024 2025
1000
2021 2022 2023 2024 2025
NOTE: Mantengu Mining Ltd. underwent a 1000:1 share consolidation
on 29 March 2023, historical figures have been adjusted. FINANCIAL STATISTICS
FINANCIAL STATISTICS (USD ’000) Mar 25 Mar 24 Mar 23 Mar 22 Sep 21
Feb 25 Feb 24 Feb 23 Feb 22 Feb 21 Final Final Final(rst) Final Final
(R ’000)
Final Final Final(rst) Final Final Turnover 80 997 83 005 95 819 201 123 132 945
Turnover 317 497 109 925 4 492 - - Op Inc 967 3 062 - 1 273 12 562 7 635
Op Inc 3 961 24 900 - 15 791 8 547 1 141 NetIntPd(Rcvd) 594 576 570 3 383 2 075
NetIntPd(Rcvd) 61 112 30 218 6 311 383 2 635 Minority Int - 50 - 1 402 - 383 842 -
Att Inc 303 312 1 166 - 16 906 7 650 - 1 494 Att Inc 354 5 250 200 4 589 2 407
TotCompIncLoss 303 312 1 166 - 16 906 7 650 3 935 TotCompIncLoss 778 2 586 - 5 309 10 917 6 708
Fixed Ass 534 975 250 650 202 171 112 497 - Fixed Ass 10 115 9 712 34 645 36 675 32 745
Tot Curr Ass 405 888 154 070 32 133 4 345 1 405 Inv & Loans 31 957 24 689 32 461 33 247 38 248
Ord SH Int 509 339 99 417 78 716 46 753 - 22 366 Tot Curr Ass 60 152 68 455 63 385 78 231 67 313
LT Liab 169 759 127 873 115 312 - - Ord SH Int 87 636 88 220 85 370 90 698 87 557
Tot Curr Liab 428 968 223 915 88 408 71 065 23 771 Minority Int - 2 345 3 978 5 390 5 086
1 381
1 275
PER SHARE STATISTICS (cents per share) LT Liab 15 154 19 178 13 370 15 246 14 599
38 379
28 424
Tot Curr Liab
33 062
HEPS-C (ZARc) - 23.00 1.00 - 12.00 6.00 - 170.00
NAV PS (ZARc) 178.00 58.00 55.64 34.00 - 2 591.50 PER SHARE STATISTICS (cents per share)
3 Yr Beta - 0.69 - 0.49 0.24 - - HEPS-C (ZARc) 41.80 119.87 - 88.45 124.50 105.29
Price High 190 1 000 3 000 3 000 3 000 DPS (ZARc) 71.14 70.30 67.51 30.10 57.24
Price Low 56 10 1 000 3 000 3 000 NAV PS (ZARc) 4 484.74 4 578.62 4 223.54 3 703.04 3 684.40
Price Prd End 62 85 1 000 3 000 3 000 Price High 3 565 3 250 3 519 3 000 3 000
RATIOS Price Low 2 624 2 200 2 200 1 727 1 727
2 400
Price Prd End
2 225
2 864
2 624
2 368
Ret on SH Fnd 59.55 1.17 - 21.48 16.36 6.68
Oper Pft Mgn 1.25 22.65 - 351.54 - - RATIOS
D:E 0.33 1.29 1.46 - - Ret on SH Fnd 0.35 4.25 - 0.20 3.77 2.60
Current Ratio 0.95 0.69 0.36 0.06 0.06 Oper Pft Mgn 1.19 3.69 - 1.33 6.25 5.74
D:E 0.07 0.09 0.26 0.27 0.29
Current Ratio 3.97 3.57 2.23 2.04 2.04
Div Cover 0.26 3.89 0.15 6.38 1.27
www.sharedata.co.za www.sharedata.co.za
140