
Page 137 - Profile's Stock Exchange Handbook - 2025 Issue 3
P. 137
Profile’s Stock Exchange Handbook: 2025 - Issue 3 JSE - KOR
Kore Potash plc Kumba Iron Ore Ltd.
ISIN: GB00BYP2QJ94 SHORT: KORE CODE: KP2 ISIN: ZAE000085346 SHORT: KUMBA CODE: KIO
REG NO: 10933682 FOUNDED: 2017 LISTED: 2018 REG NO: 2005/015852/06 FOUNDED: 2005 LISTED: 2006
NATURE OF BUSINESS: Kore Potash is an advanced stage mineral NATURE OF BUSINESS: Kumba Iron Ore, a business unit of Anglo
exploration and development company that is incorporated in American plc (its largest shareholder), is a single commodity
England and Wales and listed on AIM, a market operated by the iron ore minerals company listed on the JSE in South Africa, with
London Stock Exchange, the Australian Securities Exchange a market cap of R198 billion (as at 31 December 2023). Kumba
(ASX) and the JSE in South Africa. Through the development of competes in the global iron ore market through its premium
the Sintoukola potash basin in the Republic of Congo (RoC), Kore product delivery, with its business structured around its two open-
Potash is working to bring a number of globally significant potash pit mines in the Northern Cape province of South Africa.
deposits into production. Focus is on two high-grade projects: Kola SECTOR: Basic Materials--Basic Resrcs--Ind Met & Min--Iron & Steel
and DX. NUMBER OF EMPLOYEES: 11 612
SECTOR: Basic Materials--Basic Resrcs--Ind Met & Min--General Mining DIRECTORS: Bomela M S (ld ind ne), Fernandes R (ne), Goliath M
NUMBER OF EMPLOYEES: 21 (ind ne), Jeawon A (ind ne), Jenkins M A (ind ne), Langa-Royds N B
DIRECTORS: Kumar Mehta A K (ne), Netherway D (snr ind ne), Pulinx W (ne), (ind ne), Mokhesi N V (ind ne), Ntsaluba S S (ind ne), Walker M (ne),
Trollip J (ind ne), Hathorn D A (Chair, ne), Baya A (CEO), Maruta A (CFO) Goodlace T P (Chair, ind ne), Zikalala N D (CEO), Mazarura B A (CFO)
MAJOR ORDINARY SHAREHOLDERS as at 2 Apr 2025 MAJOR ORDINARY SHAREHOLDERS as at 31 Dec 2024
Princess Aurora Company Pte. Ltd. 15.12% Anglo South Africa (Pty) Ltd. 69.71%
Harlequin Investments Ltd. 12.73% Industrial Development Corporation of SA Ltd. 12.88%
Sociedad Quimica y Minera de Chile SA (SQM) 12.29% Government Employees Pension Fund 2.65%
MORE INFO: www.sharedata.co.za/sdo/jse/KP2 POSTAL ADDRESS: Postnet Suite 153, Private Bag X31, Saxonwold, 2132
COMPANY SECRETARY: SJCS and Henko Vos MORE INFO: www.sharedata.co.za/sdo/jse/KIO
TRANSFER SECRETARY: Computershare Investor Services (Pty) Ltd. COMPANY SECRETARY: Fazila Patel
SPONSOR: Questco Corporate Advisory (Pty) Ltd. TRANSFER SECRETARY: Computershare Investor Services (Pty) Ltd.
AUDITORS: BDO LLP SPONSOR: Rand Merchant Bank (A division of FirstRand Bank Ltd.)
CAPITAL STRUCTURE Authorised Issued AUDITORS: PwC Inc.
KP2 Ords US0.001c - 4 856 248 999 CAPITAL STRUCTURE Authorised Issued
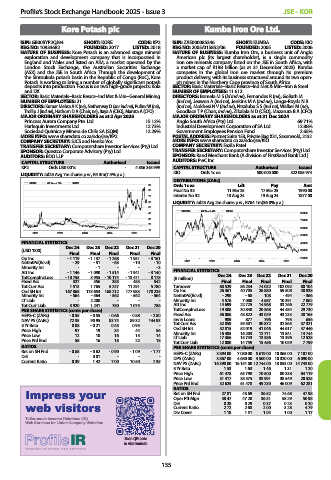
LIQUIDITY: Jul25 Avg 7m shares p.w., R4.3m(7.4% p.a.) KIO Ords 1c ea 500 000 000 322 085 974
DISTRIBUTIONS [ZARc]
KORE 40 Week MA INDM
90 Ords 1c ea Ldt Pay Amt
80 Final No 33 11 Mar 25 17 Mar 25 1990.00
70 Interim No 32 13 Aug 24 19 Aug 24 1877.00
60 LIQUIDITY: Jul25 Avg 2m shares p.w., R764.1m(36.0% p.a.)
50
KUMBA 40 Week MA INDM
40 80000
30
70000
20
60000
10
2021 2022 2023 2024 2025
50000
FINANCIAL STATISTICS 40000
(USD ’000) Dec 24 Dec 23 Dec 22 Dec 21 Dec 20 30000
Final Final Final Final Final
Op Inc - 1 119 - 1 137 - 1 268 - 1 951 - 3 161 20000
NetIntPd(Rcvd) - 29 - 51 - 63 - 10 - 10 2021 2022 2023 2024 2025
Minority Int - - 1 - - - 3
Att Inc - 1 146 - 1 090 - 1 514 - 1 941 - 3 140 FINANCIAL STATISTICS
TotCompIncLoss - 10 755 3 955 - 10 174 - 13 471 8 178 (R million) Dec 24 Dec 23 Dec 22 Dec 21 Dec 20
Fixed Ass 327 356 385 483 542 Final Final Final Final Final
Tot Curr Ass 1 513 1 765 5 247 11 291 5 780 Turnover 68 529 86 234 74 032 102 092 80 104
Ord SH Int 167 868 175 653 168 212 177 983 178 225 Op Inc 26 361 40 705 26 880 59 508 40 838
Minority Int - 564 - 564 - 562 - 562 - 564 NetIntPd(Rcvd) - 290 - 68 108 - 494 - 366
LT Liab - 2 200 - - - Minority Int 4 576 7 080 4 687 10 391 7 062
Tot Curr Liab 3 920 1 241 750 1 075 786 Att Inc 14 699 22 725 14 968 33 266 22 779
PER SHARE STATISTICS (cents per share) TotCompIncLoss 19 308 30 840 20 368 44 484 29 730
HEPS-C (ZARc) - 0.55 - 0.55 - 0.66 - 0.88 - 2.80 Fixed Ass 56 006 48 822 43 029 43 233 40 165
NAV PS (ZARc) 72.35 90.95 83.74 89.32 144.93 Inv & Loans 989 877 796 795 656
3 Yr Beta 0.08 - 0.21 0.45 0.95 - Tot Curr Ass 32 859 39 501 30 872 32 865 37 321
Price High 97 19 34 44 56 Ord SH Int 52 815 52 019 41 046 44 617 47 446
Minority Int
12 771
13 841
14 744
16 485
16 203
Price Low 12 10 16 15 14 LT Liab 17 366 15 743 13 386 13 396 12 528
Price Prd End 58 16 18 22 18 Tot Curr Liab 12 080 14 759 15 456 10 029 7 799
RATIOS PER SHARE STATISTICS (cents per share)
Ret on SH Fnd - 0.68 - 0.62 - 0.90 - 1.09 - 1.77 HEPS-C (ZARc) 3 894.00 7 080.00 5 619.00 10 365.00 7 107.00
D:E - 0.01 - - - DPS (ZARc) 3 867.00 4 680.00 4 500.00 10 320.00 6 090.00
Current Ratio 0.39 1.42 7.00 10.50 7.35 NAV PS (ZARc) 16 398.00 16 151.00 12 744.00 13 853.00 14 743.00
3 Yr Beta 1.53 1.63 1.46 1.31 1.20
Price High 61 478 63 798 70 500 80 338 64 119
Price Low 31 417 38 575 33 991 38 549 20 525
Price Prd End 32 625 61 478 49 230 46 009 62 281
Impress your
Impr ess y our RATIOS 27.81 43.69 36.52 74.68 47.98
Ret on SH Fnd
50.98
58.29
36.31
47.20
Oper Pft Mgn
38.47
web visitors
w e b visitor s D:E 0.28 0.29 0.37 0.23 0.20
2.00
3.28
2.72
4.79
Current Ratio
2.68
1.17
Div Cover
1.51
1.00
1.18
1.04
Tailor-made Investor Relations (IR)
Web Services for Listed Company Websites
Scan QR code
to visit website
135