
Page 143 - Profile's Stock Exchange Handbook - 2025 Issue 3
P. 143
Profile’s Stock Exchange Handbook: 2025 - Issue 3 JSE - MAS
MAS plc Master Drilling Group Ltd.
ISIN: VGG5884M1041 SHORT: MAS CODE: MSP ISIN: ZAE000171948 SHORT: MASTDRILL CODE: MDI
REG NO: C99355 FOUNDED: 2008 LISTED: 2009 REG NO: 2011/008265/06 FOUNDED: 1986 LISTED: 2012
NATURE OF BUSINESS: MAS plc is a property investor and operator NATURE OF BUSINESS: Master Drilling was established in 1986 and
listed on the main board of the Johannesburg Stock Exchange. The listed on the Johannesburg Stock Exchange Ltd. in 2012. The Group
group is internally managed, combining investment, acquisition, is an investment holding company, whose subsidiary companies
leasing, asset and property management, marketing, and finance provide specialised drilling services and provides solutions that
skills. Capital previously invested in WE will be redeployed directly enforce business rules, optimise output, safe-guard miners,
in income property in CEE and indirectly, on a downside protected protect/manage assets and locate missing persons to blue chip
basis, in developments via further preference shares in the DJV major and mid-tier companies in the mining, civil engineering,
with co-investor, developer and general contractor Prime Kapital. construction, and hydro-electric power sectors, across a number of
SECTOR: RealEstate--RealEstate--InvestmentServices--Holdings commodities and geographies.
NUMBER OF EMPLOYEES: 0 SECTOR: Basic Materials--Basic Resrcs--Ind Met & Min--General Mining
DIRECTORS: Briffa S, Iuga V (ind ne), Oslobeanu B, Pascariu C D NUMBER OF EMPLOYEES: 3 112
(ind ne, Rom), Pendred C (ld ind ne), Vasilescu M (ne), Grigore I (CEO), DIRECTORS: Brink A W (ld ind ne), Deshmukh A A (ind ne), Faul H J
Alberts W (Acting Chair, ld ind ne) (ind ne), Ramathe M (ind ne), Sheppard G R (alt), van der Merwe H
MAJOR ORDINARY SHAREHOLDERS as at 30 Jun 2024 (Chair, ind ne), Pretorius D C (CEO), Dixon E (COO, alt), Jordaan B J
PK Investments Ltd. 18.70% (Technical), van Deventer A J (CFO)
Government Employees Pension Fund 11.74% MAJOR ORDINARY SHAREHOLDERS as at 31 Dec 2024
Eastland 5.94% Barrange (Pty) Ltd. 29.00%
POSTAL ADDRESS: Suite 11, Marina Business Centre, Abate Rigord MDG Equity Holdings (Pty) Ltd. 25.90%
Street, Ta’ Xbiex, XBX1129 Ninety One Ltd. 7.80%
MORE INFO: www.sharedata.co.za/sdo/jse/MSP POSTAL ADDRESS: PO Box 902, Fochville, 2515
COMPANY SECRETARY: Stefan Briffa MORE INFO: www.sharedata.co.za/sdo/jse/MDI
TRANSFER SECRETARY: Computershare Investor Services (Pty) Ltd. COMPANY SECRETARY: Andrew Colin Beaven
SPONSOR: Java Capital Trustees and Sponsors (Pty) Ltd. TRANSFER SECRETARY: Computershare Investor Services (Pty) Ltd.
AUDITORS: PwC Malta SPONSOR: Investec Bank Ltd.
CAPITAL STRUCTURE Authorised Issued AUDITORS: BDO SA
MSP Ords EUR1c ea 1 500 000 000 716 145 729 CAPITAL STRUCTURE Authorised Issued
DISTRIBUTIONS [EURc] MDI Ords no par value 500 000 000 150 536 779
Ords EUR1c ea Ldt Pay Amt DISTRIBUTIONS [ZARc]
Interim No 23 20 Mar 23 3 Apr 23 4.36 Ords no par value Ldt Pay Amt
Final No 22 20 Sep 22 26 Sep 22 3.82 Final No 7 17 Jun 25 23 Jun 25 65.00
LIQUIDITY: Jul25 Avg 8m shares p.w., R159.8m(58.2% p.a.) Final No 6 14 May 24 20 May 24 52.50
LIQUIDITY: Jul25 Avg 224 514 shares p.w., R2.9m(7.8% p.a.)
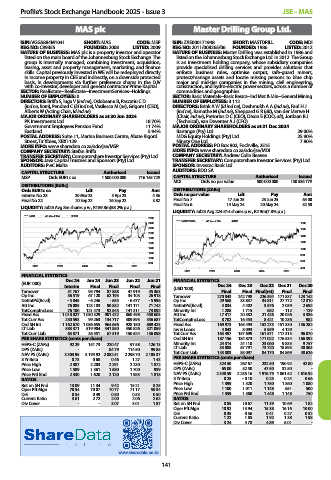
MAS 40 Week MA REDS
2600
MASTDRILL 40 Week MA INDM
2400 1800
2200
1600
2000
1400
1800
1600 1200
1400 1000
1200
800
1000
600
800
2021 2022 2023 2024 2025
400
2021 2022 2023 2024 2025
FINANCIAL STATISTICS
Dec 24 Jun 24 Jun 23 Jun 22 Jun 21 FINANCIAL STATISTICS
(EUR ’000)
Interim Final Final Final Final (USD ’000) Dec 24 Dec 23 Dec 22 Dec 21 Dec 20
Turnover 51 767 95 794 87 888 47 919 45 363 Final Final Final(rst) Final Final
Op Inc 36 519 67 120 62 195 34 103 26 918 Turnover 270 843 242 798 226 394 171 837 123 142
NetIntPd(Rcvd) - 5 045 - 6 246 - 635 - 6 477 - 5 996 Op Inc 29 568 33 837 34 811 27 772 12 310
Att Inc 76 085 123 183 90 832 141 171 71 742 NetIntPd(Rcvd) 4 034 4 402 3 576 2 039 2 692
TotCompIncLoss 76 100 121 473 92 545 141 311 73 092 Minority Int 1 288 1 715 682 - 112 - 129
Fixed Ass 1 018 827 1 030 329 901 472 860 498 458 603 Att Inc 17 417 20 582 21 426 20 026 3 336
Tot Curr Ass 230 593 99 263 134 717 309 893 356 687 TotCompIncLoss 8 702 16 453 8 421 10 236 982
Ord SH Int 1 162 670 1 086 655 964 656 928 150 869 423 Fixed Ass 169 973 165 493 152 275 151 330 156 282
LT Liab 583 371 519 904 441 850 450 826 321 059 Inv & Loans 4 043 8 093 5 959 4 129 -
Tot Curr Liab 63 871 36 551 67 519 150 624 136 098 Tot Curr Ass 163 497 157 699 161 571 117 315 96 070
PER SHARE STATISTICS (cents per share) Ord SH Int 187 156 184 873 171 022 176 534 166 392
HEPS-C (ZARc) 92.29 151.73 220.47 97.58 126.13 Minority Int 24 314 24 110 23 060 9 835 9 757
DPS (ZARc) - - 84.79 114.50 99.85 LT Liab 33 088 67 791 73 720 18 893 40 363
NAV PS (ZARc) 3 303.95 3 194.92 2 882.51 2 298.70 2 105.37 Tot Curr Liab 133 803 85 097 84 170 84 869 48 626
3 Yr Beta 0.73 0.68 0.46 1.27 1.43 PER SHARE STATISTICS (cents per share)
Price High 2 387 2 203 2 291 2 230 1 872 HEPS-C (ZARc) 324.50 267.67 232.50 190.92 42.80
Price Low 1 589 1 361 1 680 1 700 939 DPS (ZARc) 65.00 52.50 47.50 32.50 -
Price Prd End 2 330 1 620 2 120 1 985 1 818 NAV PS (ZARc) 2 348.59 2 235.16 1 916.79 1 861.52 1 616.92
RATIOS 3 Yr Beta 0.25 - 0.10 0.25 0.24 0.66
Ret on SH Fnd 13.09 11.34 9.42 15.21 8.25 Price High 1 399 1 520 1 750 1 360 1 080
Oper Pft Mgn 70.54 70.07 70.77 71.17 59.34 Price Low 1 100 1 011 1 148 651 500
D:E 0.54 0.49 0.50 0.53 0.50 Price Prd End 1 359 1 360 1 448 1 148 750
Current Ratio 3.61 2.72 2.00 2.06 2.62 RATIOS
Div Cover - - 3.07 3.01 1.87 Ret on SH Fnd 8.85 10.67 11.39 10.69 1.82
Oper Pft Mgn 10.92 13.94 15.38 16.16 10.00
D:E 0.35 0.36 0.41 0.27 0.32
Current Ratio 1.22 1.85 1.92 1.38 1.98
Div Cover 3.24 4.78 4.89 6.01 -
www.sharedata.co.za
141