
Page 28 - Profile's Stock Exchange Handbook - 2025 Issue 1
P. 28
NSX – NAM Profile’s Stock Exchange Handbook: 2025 – Issue 1
Namibia Asset Management Ltd. Namibia Breweries Ltd.
NAM NBS
ISIN: NA000AOJMZ44 SHORT: NAM CODE: NAM ISIN: NA0009114944 SHORT: NBL CODE: NBS
REG NO: 97/397 FOUNDED: 1997 LISTED: 1998 REG NO: 2/1920 FOUNDED: 1920 LISTED: 1996
NATURE OF BUSINESS: Namibia Asset Management (Pty) Ltd. was NATURE OF BUSINESS: Established in 1920, NBL is the leading beverage
founded in April 1996 as a wholly-owned subsidiary of Namibian Harvest manufacturing company in Namibia and one of the last few independently
Investments Ltd. (NHI) to provide independent asset management ownedcommercial-scale breweries in southern Africa. NBL’s is oneof only
services to institutional and retail investors. NHI was a broadly diversified a few large-scale commercial breweries in Africa that brew according to the
financial services group that was successfully listed on the NSX in July German Reinheitsgebot (“Purity Law") of 1516, which prescribes that
1998. After ten years in existence, the NHI board of directors decided to malted barley, hops and water are the only ingredients used in brewing.
refocus the business on asset management only. Thus all the non-core Our commitment to the Reinheitsgebot guarantees quality beer brewed
businesses have been closed. from safe, natural ingredients.
SECTOR: Fins—FinServcs—InvBnkng&BrokerServcs—AssMgrs&Custodians SECTOR: CnsStp—FoodBev&Tob—Beverages—Brewers
NUMBER OF EMPLOYEES: 0 NUMBER OF EMPLOYEES: 983
DIRECTORS: Breedt J (CFO & Co Secretary), Angula E (ind ne, Namb), DIRECTORS: BelJB(ne), DurandJJ(ne), GerdesHB(ne, Namb),
Hornung S (ind ne), Kandongo E (ind ne), Kapenda A (ind ne), Marcus N Mokgatle-AukhumesMK(ne), PirmezRJM(ne, Blgm), Santry K (ne),
(ind ne), Rhoda A, Rossouw B (ind ne, Namb), Smith L (ne), Schimming-ChaseAR(ne), ShiyukaAJH(ne), Yedikardesler Y (ne),
WaltersSW(ind ne, Namb), Young G (ind ne), Shaanika T (CEO, Namb) Mungunda V J (Chair, ne, Namb), von Lieres W (MD, Namb)
MAJOR ORDINARY SHAREHOLDERS as at 30 Sep 2023 MAJOR ORDINARY SHAREHOLDERS as at 30 Jun 2023
Coronation Investment Management (Pty) Ltd. 40.05% NBL Investment Holdings (Pty) Ltd. 59.37%
POSTAL ADDRESS: PO Box 23329, Windhoek, Namibia Government Institutions Pension Fund 15.66%
MORE INFO: www.sharedata.co.za/sdo/jse/NAM POSTAL ADDRESS: PO Box 206, Windhoek, Namibia
COMPANY SECRETARY: Janita Breedt MORE INFO: www.sharedata.co.za/sdo/jse/NBS
TRANSFER SECRETARY: Transfer Secretaries (Pty) Ltd. COMPANY SECRETARY: Hilya Ndiitaneka Herman
SPONSOR: IJG Securities (Pty) Ltd. TRANSFER SECRETARY: Transfer Secretaries (Pty) Ltd.
AUDITORS: Ernst & Young SPONSOR: PSG Wealth Management Namibia (Pty) Ltd.
AUDITORS: Deloitte & Touche (Namibia)
CAPITAL STRUCTURE AUTHORISED ISSUED
NAM Ords NAD1c ea 300 000 000 200 000 000 CAPITAL STRUCTURE AUTHORISED ISSUED
NBS Ords no par 299 000 000 206 529 000
DISTRIBUTIONS [NADc]
Ords NAD1c ea Ldt Pay Amt DISTRIBUTIONS [NADc]
Final No 22 29 Nov 24 13 Dec 24 6.00 Ords no par Ldt Pay Amt
Final No 22 1 Dec 23 14 Dec 23 6.00 Interim No 50 25 Oct 24 15 Nov 24 52.00
Interim No 49 5 Apr 24 17 May 24 150.00
LIQUIDITY: Jan25 Avg 15 193 shares p.w., R10 927.9(0.4% p.a.)
LIQUIDITY: Jan25 Avg 85 282 shares p.w., R2.5m(2.1% p.a.)
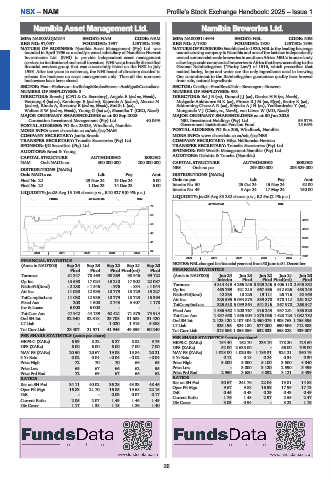
FINSA 40 Week MA NAM
40 Week MA NBL
75
66
4578
58
4156
49
3735
41
3313
32
2020 | 2021 | 2022 | 2023 | 2024 |
2891
2020 | 2021 | 2022 | 2023 | 2024 |
FINANCIAL STATISTICS
(Amts in NAD’000) Sep 24 Sep 23 Sep 22 Sep 21 Sep 20 NOTES:NBLchangeditsfinancialyearendfrom30Juneto31December.
Final Final Final Final(rst) Final FINANCIAL STATISTICS
Turnover 81 347 78 469 90 269 90 946 99 722 (Amts in NAD’000) Jun 24 Jun 23 Jun 22 Jun 21 Jun 20
Op Inc 13 690 17 024 15 210 17 902 22 087 Interim Final Final Final(rst) Final
NetIntPd(Rcvd) - 2 288 - 1 546 - 976 - 834 - 1 044 Turnover 4 814 419 4 265 246 3 929 246 3 406 110 2 645 832
Att Inc 11 030 12 935 10 779 13 729 15 227 Op Inc 465 769 421 213 667 436 612 626 453 243
42 333
32 953
NetIntPd(Rcvd)
19 111
25 716
13 225
TotCompIncLoss 11 030 12 935 10 779 13 729 15 393
Fixed Ass 200 1 508 2 743 3 407 1 170 Att Inc 325 595 5 094 873 539 878 378 112 261 327
TotCompIncLoss
325 510 5 099 364
541 316
367 970
263 547
Inv & Loans 6 000 6 000 - - -
Fixed Ass 1 486 452 1 200 767 916 243 937 281 985 323
Tot Curr Ass 47 942 44 759 62 421 71 875 74 914 Tot Curr Ass 1 437 658 1 556 904 1 875 036 1 423 723 1 082 732
Ord SH Int 32 340 32 318 29 708 31 683 31 420 Ord SH Int 2 123 120 2 107 404 2 450 079 1 908 763 1 755 895
LT Liab - - 1 020 1 915 5 388 LT Liab 925 196 524 180 577 000 690 606 712 983
Tot Curr Liab 23 407 21 571 41 945 49 359 50 240 Tot Curr Liab 818 866 1 055 056 632 033 558 028 439 007
PER SHARE STATISTICS (cents per share) PER SHARE STATISTICS (cents per share)
HEPS-C (ZARc) 6.99 8.22 6.27 8.82 9.79 HEPS-C (ZARc) 154.40 162.70 233.10 178.20 125.60
DPS (ZARc) 6.00 6.00 6.00 7.00 7.00 DPS (ZARc) 52.00 2 635.00 - 56.00 106.00
NAV PS (ZARc) 20.50 20.67 19.08 15.84 20.21 NAV PS (ZARc) 1 028.00 1 020.39 1 186.31 924.21 850.19
3 Yr Beta 0.02 0.04 - 0.04 - 0.02 - 0.04 3 Yr Beta 0.12 0.18 0.24 0.34 0.30
Price High 72 70 70 66 65 Price High 3 800 5 000 5 100 3 500 4 840
Price Low 69 67 66 62 55 Price Low - 3 000 3 120 2 590 3 499
Price Prd End 72 69 67 66 62 Price Prd End 2 950 3 680 4 092 3 121 3 499
RATIOS RATIOS
Ret on SH Fnd 34.11 40.02 36.28 43.33 48.46 Ret on SH Fnd 30.67 241.76 22.04 19.81 14.88
17.13
17.99
16.99
Oper Pft Mgn
9.67
9.88
Oper Pft Mgn 16.83 21.70 16.85 19.68 22.15
D:E - - 0.03 0.07 0.17 D:E 0.45 0.43 0.29 0.43 0.49
2.47
Current Ratio
1.48
2.97
1.76
2.55
Current Ratio 2.05 2.07 1.49 1.46 1.49 Div Cover 3.03 0.94 - 3.23 1.19
Div Cover 1.17 1.38 1.15 1.26 1.40
26