
Page 23 - Profile's Stock Exchange Handbook - 2025 Issue 1
P. 23
Profile’s Stock Exchange Handbook: 2025 – Issue 1 NSX – B2G
B2Gold Corporation Bannerman Energy Ltd.
B2G BMN
ISIN: CA11777Q2099 SHORT: B2GOLD CODE: B2G ISIN: AU000000BMN9 SHORT: BANNERMAN CODE: BMN
REG NO: BC0776025 FOUNDED: 2007 LISTED: 2012 REG NO: ABN 34 113 017 128 FOUNDED: 2005 LISTED: 2008
NATURE OF BUSINESS: B2Gold is a low-cost international senior gold NATURE OF BUSINESS: Bannerman Energy Ltd. is a uranium
producer headquartered in Vancouver, Canada. Founded in 2007, today, development company listed on the Australian and Namibian stock
B2Gold has operating gold mines in Mali, Namibia and the Philippines and exchanges and traded on the OTCQX Market in the US. Its flagship asset,
numerousexplorationanddevelopmentprojectsinvariouscountriesincluding the advanced Etango Uranium Project located in the Erongo Region of
Mali, Colombia, Burkina Faso, Finland and Uzbekistan. B2Gold forecasts total Namibia, Southern Africa, is one of the largest undeveloped uranium
consolidated gold production of between 970 000 and 1 030 000 ounces in assets in the world.
2021. SECTOR:BasicMaterials—BasicResrcs—IndMet&Min—NonferrousMet
SECTOR:BasicMaterials—BasicResrcs—PreciousMet&Min—GoldMin NUMBER OF EMPLOYEES: 20
NUMBER OF EMPLOYEES: 5 392 DIRECTORS: McFadzean B (ne), Munro B (MD and CEO), Jones C (ind ne),
DIRECTORS: Barnes G (ne), CrossR(ind ne), Gayton Dr R J (ne), Burvill I (ind ne), Leech M (ind ne), Terry A (ind ne)
Johnson G (ne), Kevin B (ne), Korpan J (ne), Maree B (ne), Mtshisi B (ne), MAJOR ORDINARY SHAREHOLDERS as at 30 Jun 2024
Weisman R (ne), Johnson C (CEO & President) Citicorp Nominees (Pty) Ltd. 23.11%
POSTAL ADDRESS: PO Box 49143, Vancouver, BC, Canada, V7X 1J1 HSBC Custody Nominees (Australia) Ltd. 17.09%
MORE INFO: www.sharedata.co.za/sdo/jse/B2G JP Morgan Nominees Australia (Pty) Ltd. 8.00%
COMPANY SECRETARY: Roger Richer POSTAL ADDRESS: PO Box 1973, Subiaco Western Australia, 6904
AUDITORS: PwC LLP MORE INFO: www.sharedata.co.za/sdo/jse/BMN
CAPITAL STRUCTURE AUTHORISED ISSUED COMPANY SECRETARY: Steve Herlihy
B2G Cmn shrs no par val - 1 063 053 499 AUDITORS: Ernst & Young
CAPITAL STRUCTURE AUTHORISED ISSUED
DISTRIBUTIONS [USDc] BMN Ord shrs no par va - 178 685 714
Cmn shrs no par val Ldt Pay Amt
Quarterly No 16 29 Nov 24 12 Dec 24 4.00 LIQUIDITY: Jan25 Avg 5 353 shares p.w., R275 257.7(0.2% p.a.)
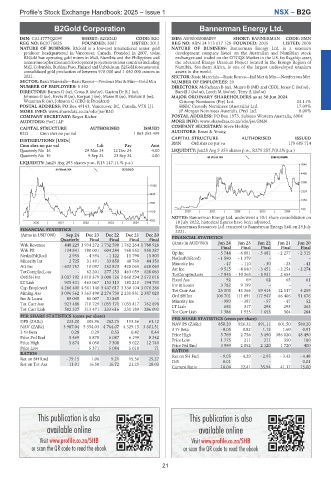
Quarterly No 15 9 Sep 24 23 Sep 24 4.00 40 Week MA BANNERMAN
LIQUIDITY: Jan25 Avg 293 shares p.w., R15 147.1(-% p.a.) 5540
40 Week MA B2GOLD
4468
3396
11092
2324
9445
1252
7797
180
6150 2020 | 2021 | 2022 | 2023 | 2024 |
NOTES: Bannerman Energy Ltd. underwent a 10:1 share consolidation on
4502 18 July 2022, historical figures have been adjusted.
2020 | 2021 | 2022 | 2023 | 2024 |
Bannerman Resources Ltd. renamed to Bannerman Energy Ltd. on 29 July
FINANCIAL STATISTICS 2021.
(Amts in USD’000) Sep 24 Dec 23 Dec 22 Dec 21 Dec 20
Quarterly Final Final Final Final FINANCIAL STATISTICS
Wrk Revenue 448 229 1 934 272 1 732 590 1 762 264 1 788 928 (Amts in AUD’000) Jun 24 Jun 23 Jun 22 Jun 21 Jun 20
Final
Final
Final
Final
Final
Wrk Pft 134 841 780 001 604 244 768 552 958 287 Op Inc - 5 744 - 6 081 - 3 481 - 2 277 - 2 315
NetIntPd(Rcd) 2 955 - 4 594 - 1 122 11 798 15 803
Minority Int 2 725 31 491 33 850 40 760 44 350 NetIntPd(Rcvd) - 1 590 - 1 379 - 30 - - 23 - - 41 -
Minority Int
- 47
- 110
Att Inc - 633 757 10 097 252 873 420 065 628 063 Att Inc - 9 515 - 4 640 - 3 451 - 2 254 - 2 274
TotCompIncLoss - 62 201 277 153 463 059 628 063 TotCompIncLoss - 7 945 - 10 363 - 5 931 2 654 -
Ord SH Int 3 037 192 3 810 379 3 008 126 2 860 294 2 572 016 Fixed Ass 92 69 62 65 61
LT Liab 935 431 463 067 153 313 181 210 194 793
9 199
3 782
Cap Employed 4 286 400 4 561 148 3 447 617 3 330 104 3 076 286 Inv & Loans 25 003 43 366 59 414 - 12 517 - 4 259 -
Tot Curr Ass
Mining Ass 3 096 562 3 563 490 2 274 730 2 231 831 2 387 020 Ord SH Int 106 701 111 091 117 947 66 406 51 676
Inv & Loans 89 045 86 007 31 865 - - Minority Int - 990 - 387 - 57 - 47 52
Tot Curr Ass 921 488 710 729 1 035 171 1 033 417 762 698 LT Liab 692 317 298 295 263
Tot Curr Liab 502 337 313 471 233 616 231 189 286 093
Tot Curr Liab 1 386 1 935 1 653 304 284
PER SHARE STATISTICS (cents per share) PER SHARE STATISTICS (cents per share)
DPS (ZARc) 223.20 305.96 262.75 113.36 61.12 NAV PS (ZARc) 850.29 926.32 891.11 601.50 580.20
NAV (ZARc) 3 987.04 5 354.03 4 764.07 4 329.15 3 601.51 3 Yr Beta - 0.05 0.82 1.13 1.60 0.91
3 Yr Beta 0.28 0.29 0.53 0.42 0.44 Price High 5 769 2 756 3 490 386 820 48 490
Price Prd End 5 469 5 878 6 087 6 199 8 342 Price Low 1 775 211 211 350 180
Price High 5 874 8 050 7 308 9 022 12 740 Price Prd End 3 999 2 052 2 120 1 720 400
Price Low - 5 371 5 084 5 018 71
RATIOS
RATIOS Ret on SH Fnd - 9.05 - 4.29 - 2.95 - 3.43 - 4.48
Ret on SH fund - 79.15 1.06 9.21 15.56 25.27 D:E 0.01 - - - 0.01
Ret on Tot Ass 11.01 16.50 16.72 21.25 28.03
Current Ratio 18.04 22.41 35.94 41.17 15.00
21