
Page 24 - Profile's Stock Exchange Handbook - 2025 Issue 1
P. 24
NSX – CGP Profile’s Stock Exchange Handbook: 2025 – Issue 1
Capricorn Group Ltd. Celsius Resources Ltd.
CGP CER
ISIN: NA000A1T6SV9 SHORT: CAP GROUP CODE: CGP ISIN: AU000000CLA6 SHORT: CELSIUS CODE: CER
REG NO: 96/300 FOUNDED: 1996 LISTED: 2013 REG NO: F/ACN 009 162 949 FOUNDED: 1986 LISTED: 2018
NATURE OF BUSINESS: Capricorn Group is a leading Namibian-owned NATURE OF BUSINESS: Celsius Resources (ASX:CLA) is an ASX listed
financial services group listed on the NSX. We have three banking resources company with asecondarylisting onthe NSX, aiming toleverage
subsidiaries operating in Namibia, Botswana and Zambia, with other off the coming boom in battery technology. Celsius is currently focused on
subsidiaries and associates providing adjacent and complementary cobalt projects and is looking to strategically add projects with the
products and services. Our customers range from personal to corporate, potential to contribute metals and materials into the construction and
small and medium enterprises. Our value proposition is built around usage of batteries.
customers rather than products or channels. We apply data and digital SECTOR:BasicMaterials—BasicResrcs—IndMet&Min—GeneralMining
technology in transactionalbanking services, products andfunctionality to NUMBER OF EMPLOYEES: 0
address future customer needs. DIRECTORS: DudleyPJ(ind ne), Farrell S (ne), Hulmes M (ne), van
SECTOR: Fins—Banks—Banks—Banks Kerkwijk M, Sarmiento J ( (Chair, ne), Gregory R (MD), Bannister
NUMBER OF EMPLOYEES: 2 359 D (CFO)
DIRECTORS: Amutenya O (ne), BrandtJW(ne), Fahl E (ind ne), MAJOR ORDINARY SHAREHOLDERS as at 10 Sep 2024
Gomachas R (ne, Namb), KaliDT(ind ne), Reyneke D (ind ne), Computershare Clearing (Pty) Ltd. (CCNL DI A/C) 11.41%
Solomon E (ind ne), Nuyoma D (CEO), Maass J (CFO), HSBC Custody Nominees (Australia) Ltd. 11.04%
Swanepoel J J (Chair, ne), FourieDG(ld ind ne), PrinslooMJ(ne) BNP Paribas Nominees (Pty) Ltd. 5.14%
MAJOR ORDINARY SHAREHOLDERS as at 30 Jun 2024 POSTAL ADDRESS:POBox7059, CloistersSquarePO,PerthWA,6850
Capricorn Investment Holdings Ltd. 44.00% MORE INFO: www.sharedata.co.za/sdo/jse/CER
Government Institutions Pension Fund 26.90% COMPANY SECRETARY: Kellie Davis
Nam-mic Financial Services Holdings (Pty) Ltd. 8.00% SPONSOR: IJG Securities (Pty) Ltd.
POSTAL ADDRESS: PO Box 15, Windhoek, Namibia AUDITORS: PwC Inc., RSM Australia Partners
MORE INFO: www.sharedata.co.za/sdo/jse/CGP
COMPANY SECRETARY: H G von Ludwiger CAPITAL STRUCTURE AUTHORISED ISSUED
TRANSFER SECRETARY: Transfer Secretaries (Pty) Ltd. CER Ords no par val - 2 669 238 452
SPONSOR: PSG Konsult Wealth Management (Namibia)
AUDITORS: PwC Inc. 40 Week MA CELSIUS
73
CAPITAL STRUCTURE AUTHORISED ISSUED
CGP Ords NAD2.5c ea 600 000 000 518 385 351
60
DISTRIBUTIONS [NADc]
Ords NAD2.5c ea Ldt Pay Amt 47
Final No 25 27 Sep 24 18 Oct 24 64.00
33
Interim No 24 14 Mar 24 5 Apr 24 48.00
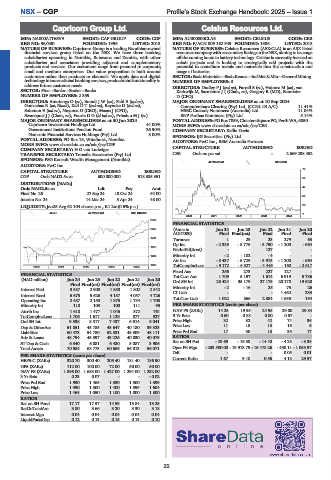
LIQUIDITY: Jan25 Avg 62 104 shares p.w., R1.2m(0.6% p.a.) 20
ALSH 40 Week MA CAP GROUP 7
2020 | 2021 | 2022 | 2023 | 2024 |
2319
FINANCIAL STATISTICS
(Amts in Jun 24 Jun 23 Jun 22 Jun 21 Jun 20
2055
AUD’000) Final Final(rst) Final Final Final
1791 Turnover 1 29 23 279 63
Op Inc - 2 335 - 5 775 - 3 790 - 1 200 - 664
1528
NetIntPd(Rcvd) - - 127 - -
1264 Minority Int - 2 - 102 - 4 - -
Att Inc - 8 437 - 5 729 - 3 913 - 1 200 - 664
1000 TotCompIncLoss - 9 172 - 6 527 - 4 446 - 160 - 2 617
2020 | 2021 | 2022 | 2023 | 2024 |
Fixed Ass 256 273 227 127 -
FINANCIAL STATISTICS Tot Curr Ass 1 709 5 197 1 614 6 919 5 736
(NAD million) Jun 24 Jun 23 Jun 22 Jun 21 Jun 20 Ord SH Int 28 424 35 179 27 175 28 178 19 620
Final Final(rst) Final(rst) Final(rst) Final(rst)
75
26
Interest Paid 3 587 2 908 1 850 1 802 2 542 Minority Int - 2 - - 16 - 25 - 1 462 233
LT Liab
Interest Rcvd 6 675 5 626 4 187 4 057 4 726
Operating Inc 2 487 2 150 1 875 1 734 1 708 Tot Curr Liab 1 022 566 2 884 1 655 194
Minority Int 118 103 100 111 95 PER SHARE STATISTICS (cents per share)
Attrib Inc 1 618 1 477 1 046 872 761 NAV PS (ZARc) 14.25 19.95 24.95 29.00 29.84
TotCompIncLoss 1 706 1 617 1 129 877 927 3 Yr Beta 0.60 0.88 0.80 0.57 -
Ord SH Int 9 598 8 517 7 437 6 614 6 041 Price High 32 32 42 74 36
Dep & OtherAcc 51 851 45 785 43 647 40 180 39 323 Price Low 11 10 13 16 6
Liabilities 60 473 54 780 52 831 48 909 48 111 Price Prd End 17 30 13 35 17
Adv & Loans 48 794 45 397 43 226 40 830 40 079 RATIOS
ST Dep & Cash 6 340 6 081 6 480 5 087 3 906 Ret on SH Fnd - 29.69 - 16.58 - 14.40 - 4.25 - 3.38
Total Assets 70 584 63 773 60 686 56 013 56 071 Oper Pft Mgn - 233 500.00 - 19 913.79 - 16 478.26 - 430.11 - 1 053.97
D:E - - - 0.05 0.01
PER SHARE STATISTICS (cents per share) Current Ratio 1.67 9.18 0.56 4.18 29.57
HEPS-C (ZARc) 320.70 300.40 205.40 181.40 186.90
DPS (ZARc) 112.00 100.00 72.00 60.00 50.00
NAV PS (ZARc) 1 896.00 1 683.00 1 427.00 1 294.00 1 232.00
3 Yr Beta 0.23 0.07 - - - 0.02
Price Prd End 1 930 1 465 1 330 1 300 1 399
Price High 1 930 1 500 1 400 1 399 1 604
Price Low 1 465 1 050 1 100 1 000 1 300
RATIOS
Ret on SH Fund 17.17 17.57 14.59 13.84 13.25
RetOnTotalAss 3.80 3.66 3.20 3.30 3.18
Interest Mgn 0.04 0.04 0.04 0.04 0.04
LiquidFnds:Dep 0.12 0.13 0.15 0.13 0.10
22