
Page 206 - Profile's Stock Exchange Handbook - 2025 Issue 1
P. 206
JSE – THU Profile’s Stock Exchange Handbook: 2025 – Issue 1
Thungela Resources Ltd. Tiger Brands Ltd.
THU TIG
ISIN: ZAE000296554 SHORT: THUNGELA CODE: TGA ISIN: ZAE000071080 SHORT: TIGBRANDS CODE: TBS
REG NO: 2021/303811/06 FOUNDED: 2020 LISTED: 2021 REG NO: 1944/017881/06 FOUNDED: 1921 LISTED: 1944
NATURE OF BUSINESS: Thungela is a leading pure-play producer and NATURE OF BUSINESS: Tiger Brands is one of Africa’s largest, listed
exporter of high quality, low-cost thermal coal in South Africa. manufacturers of fast-moving consumer goods (FMCG). Its core business
Thungela is a new name in the mining industry that is rich in history. The is manufacturing, marketing and distributing everyday branded food and
company was formed when the South African thermal coal operations beverages. Tiger Brands’ products are relevant across every meal occasion
demerged from Anglo American and listed on the JSE and LSE in June and are well positioned to grow. The portfolio also includes leading brands
2021. Thungela, which means ‘to ignite’ in isiZulu, is a large pure-play in the home and personal care segments and Tiger Brands have a growing
producer and exporter of thermal coal based on aggregate coal reserves and presence in Africa.
marketable coal production, operating in South Africa and Australia. SECTOR: CnsStp—FoodBev&Tob—Food Producers—Food Products
SECTOR: Energy—Energy—OilGas&Coal—Coal NUMBER OF EMPLOYEES: 8 785
NUMBER OF EMPLOYEES: 4 841 DIRECTORS: Ajukwu M (ind ne), Braeken F (ld ind ne, Blgm),
DIRECTORS: FrenchSG(ind ne), Jekwa DrNY(ind ne), Kodisang B Mashilwane E (ind ne), Sello Adv M (ind ne), Sithole S (ne), Swartz L
M(ind ne), McKeithTD(ind ne), Mzondeki K (ind ne), (ind ne), WeberOM(ind ne), Wilson D G (ind ne), Fraser-Moleketi G J
Ntsaluba S S (Chair, ind ne), Ndlovu J (CEO), Smith D (CFO) (Chair, ind ne), Kruger T N (CEO), Govender T (CFO)
MAJOR ORDINARY SHAREHOLDERS as at 25 Oct 2024 MAJOR ORDINARY SHAREHOLDERS as at 09 Jan 2025
Public Investment Corporation (SOC) Ltd. 18.52% Silchester International Investors LLP 14.93%
Anglo American 7.96% Government Employees Pension Fund 14.57%
Allan Gray (Pty) Ltd. 5.01% FIL Ltd. 5.00%
POSTAL ADDRESS: PO Box 1521, Saxonwold, 2132 POSTAL ADDRESS: PO Box 78056, Sandton, 2146
MORE INFO: www.sharedata.co.za/sdo/jse/TGA MORE INFO: www.sharedata.co.za/sdo/jse/TBS
COMPANY SECRETARY: Altovise Alaxa Ellis COMPANY SECRETARY: Kgosi Monaisa
TRANSFER SECRETARY: Computershare Investor Services (Pty) Ltd. TRANSFER SECRETARY: Computershare Investor Services (Pty) Ltd.
SPONSOR:RandMerchantBank(AdivisionofFirstRandBankLtd.(SA)) SPONSOR: JP Morgan Equities South Africa Ltd.
AUDITORS: PwC Inc. AUDITORS: Deloitte & Touche Inc.
CAPITAL STRUCTURE AUTHORISED ISSUED CAPITAL STRUCTURE AUTHORISED ISSUED
TGA Ords no par value 10 000 000 000 140 492 585 TBS Ords 10c ea 250 000 000 180 327 980
DISTRIBUTIONS [ZARc] DISTRIBUTIONS [ZARc]
Ords no par value Ldt Pay Amt Ords 10c ea Ldt Pay Amt
Interim No 6 17 Sep 24 23 Sep 24 200.00 Final No 159 14 Jan 25 20 Jan 25 684.00
Final No 5 16 Apr 24 22 Apr 24 1000.00 Interim No 158 2 Jul 24 8 Jul 24 350.00
LIQUIDITY: Jan25 Avg 2m shares p.w., R280.2m(84.2% p.a.) LIQUIDITY: Jan25 Avg 2m shares p.w., R359.1m(45.6% p.a.)
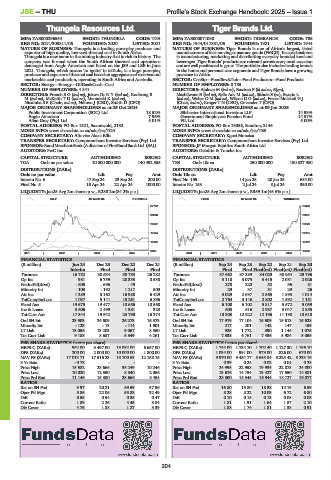
OILP 40 Week MA THUNGELA FOOD 40 Week MA TIGBRANDS
37752 29439
30849 26331
23947 23223
17044 20115
10142 17007
3239 13899
2021 | 2022 | 2023 | 2024 | 2020 | 2021 | 2022 | 2023 | 2024 |
FINANCIAL STATISTICS FINANCIAL STATISTICS
(R million) Jun 24 Dec 23 Dec 22 Dec 21 (R million) Sep 24 Sep 23 Sep 22 Sep 21 Sep 20
Interim Final Final Final Final Final Final(rst) Final(rst) Final(rst)
Turnover 16 752 30 634 50 753 26 282 Turnover 37 662 37 389 34 029 30 954 29 796
Op Inc 981 6 759 28 333 8 538 Op Inc 3 118 3 075 3 415 2 081 2 026
NetIntPd(Rcvd) - 805 - 696 - 49 - NetIntPd(Rcvd) 278 220 52 36 81
Minority Int - 103 - 192 1 217 509 Minority Int 29 37 31 29 26
Att Inc 1 289 5 162 16 988 6 429 Att Inc 3 029 2 697 2 865 1 893 1 014
TotCompIncLoss 1 037 5 141 18 261 6 896 TotCompIncLoss 2 764 3 146 2 802 1 592 1 151
Fixed Ass 19 675 19 477 10 656 10 568 Fixed Ass 6 108 6 102 5 817 5 572 5 059
Inv & Loans 3 606 2 499 1 981 323 Inv & Loans 603 616 2 987 3 047 2 855
Tot Curr Ass 17 344 19 642 23 798 16 374 Tot Curr Ass 13 303 12 922 12 196 11 198 10 618
Ord SH Int 23 903 24 609 26 273 16 573 Ord SH Int 17 979 17 104 15 609 15 613 15 628
Minority Int - 123 - 13 - 114 1 901 Minority Int 217 201 142 147 159
LT Liab 13 056 13 203 9 067 8 550 LT Liab 925 1 772 890 1 146 1 075
Tot Curr Liab 9 188 8 687 5 349 4 261 Tot Curr Liab 7 338 6 761 7 436 5 984 5 055
PER SHARE STATISTICS (cents per share) PER SHARE STATISTICS (cents per share)
HEPS-C (ZARc) 952.00 3 497.00 13 082.00 6 657.00 HEPS-C (ZARc) 1 744.00 1 734.70 1 702.40 1 127.30 1 196.10
DPS (ZARc) 200.00 2 000.00 10 000.00 1 800.00 DPS (ZARc) 1 034.00 991.00 973.00 826.00 670.00
NAV PS (ZARc) 17 013.71 17 516.23 18 700.63 12 158.15 NAV PS (ZARc) 9 970.00 9 484.77 8 655.84 8 225.42 8 233.16
3 Yr Beta - 0.78 - - - 3 Yr Beta 0.39 0.24 0.02 0.04 0.28
Price High 15 682 28 666 38 249 10 246 Price High 24 995 22 958 19 934 22 873 24 000
Price Low 10 020 12 350 8 340 2 066 Price Low 13 676 14 754 13 427 17 550 14 381
Price Prd End 11 146 15 380 28 666 8 454 Price Prd End 23 300 15 345 16 944 18 727 19 077
RATIOS RATIOS
Ret on SH Fnd 9.97 20.21 69.59 37.56 Ret on SH Fnd 16.80 15.80 18.38 12.19 6.59
Oper Pft Mgn 5.86 22.06 55.83 32.49 Oper Pft Mgn 8.28 8.22 10.03 6.72 6.80
D:E 0.55 0.54 0.35 0.47 D:E 0.10 0.15 0.13 0.08 0.08
Current Ratio 1.89 2.26 4.45 3.84 Current Ratio 1.81 1.91 1.64 1.87 2.10
Div Cover 4.76 1.88 1.27 3.39 Div Cover 1.88 1.74 1.81 1.38 0.91
204