
Page 111 - Profile's Stock Exchange Handbook -2024 Issue 4
P. 111
Profile’s Stock Exchange Handbook: 2024 – Issue 4 JSE – EFO
Efora Energy Ltd. eMedia Holdings Ltd.
EFO EME
ISIN: ZAE000248258 SHORT: EFORA CODE: EEL ISIN: ZAE000208898 SHORT: E MEDIA CODE: EMH
REG NO: 1993/000460/06 FOUNDED: 1993 LISTED: 1994 ISIN: ZAE000209524 SHORT: E MEDIA-N CODE: EMN
NATURE OF BUSINESS: Efora Energy Ltd. is a South African based REG NO: 1968/011249/06 FOUNDED: 1968 LISTED: 1994
independent African oil and gas company, listed on the JSE. The Company NATURE OF BUSINESS: eMedia Holdings Ltd. (eMedia Holdings) is a
has a diverse portfolio of assets spanning production in Egypt; exploration media investment holding company, incorporated in South Africa and
and appraisal in the Democratic Republic of Congo; midstream project listed on the JSE Ltd. under the media sector.
relatingtocrudeoiltradinginNigeriaandmaterialdownstreamdistribution SECTOR: ConsDiscr—Media—Media—Radio and TV Broadcasters
operations throughout southern Africa. The Group’s focus is on delivering NUMBER OF EMPLOYEES: 1 106
energy for the African continent by using Africa’s own resources to meet the DIRECTORS: Govender T G (ne), Govender L (ind ne), Mphande E (ind ne),
significant growth in demand expected over the next decade. Shaik Y (ne), Watson R D (ld ind ne), Copelyn J A (Chair, ne),
SECTOR: Energy—Energy—OilGas&Coal—IntegratedOil&Gas Sheriff M K (CEO), Lee A (FD)
NUMBER OF EMPLOYEES: 113 MAJOR ORDINARY SHAREHOLDERS as at 31 Mar 2023
DIRECTORS: Mngconkola P (ld ind ne), Radebe Z (ind ne), Tonjeni M (ind ne), Fulela Trade and Invest 81 (Pty) Ltd. 80.23%
Arendse D (Interim CEO), Ngonyama V (Chair, ind ne) POSTAL ADDRESS: Private Bag X9944, Sandton, Johannesburg, 2146
POSTAL ADDRESS:PostnetSuite211, PrivateBagX75,Bryanston,2021 MORE INFO: www.sharedata.co.za/sdo/jse/EMH
MORE INFO: www.sharedata.co.za/sdo/jse/EEL COMPANY SECRETARY: HCI Managerial Services (Pty) Ltd.
COMPANY SECRETARY: FusionCorporateSecretarialServices(Pty)Ltd. TRANSFER SECRETARY: Computershare Investor Services (Pty) Ltd.
TRANSFER SECRETARY: JSE Investor Services (Pty) Ltd. SPONSOR: Investec Bank Ltd.
SPONSOR: PSG Capital Ltd. AUDITORS: BDO SA
AUDITORS: SizweNtsalubaGobodo Grant Thornton Inc.
CAPITAL STRUCTURE AUTHORISED ISSUED
CAPITAL STRUCTURE AUTHORISED ISSUED EMH Ords no par 70 000 000 63 810 244
EEL Ords no par value 10 000 000 000 1 103 834 635 EMN Ords “N” no par 1 055 000 000 381 927 359
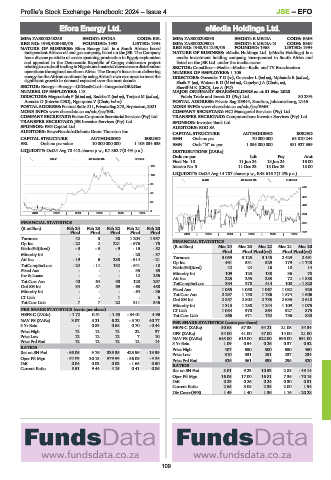
LIQUIDITY: Oct24 Avg 78 412 shares p.w., R7 862.7(0.4% p.a.) DISTRIBUTIONS [ZARc]
Ords no par Ldt Pay Amt
OILP 40 Week MA EFORA
Final No 10 11 Jun 24 18 Jun 24 16.00
152 Interim No 9 11 Dec 23 18 Dec 23 18.00
LIQUIDITY: Oct24 Avg 14 787 shares p.w., R48 616.7(1.2% p.a.)
123
ALSH 40 Week MA EMEDIA
95
555
66
491
38
428
9
2019 | 2020 | 2021 | 2022 | 2023 | 2024 364
FINANCIAL STATISTICS 301
(R million) Feb 24 Feb 23 Feb 22 Feb 21 Feb 20
Final Final Final Final Final 2019 | 2020 | 2021 | 2022 | 2023 | 2024 237
Turnover 42 8 38 1 204 1 957
Op Inc - 22 2 221 - 676 - 75 FINANCIAL STATISTICS
NetIntPd(Rcvd) - 3 - 3 - 9 - 15 - 52 (R million) Mar 24 Mar 23 Mar 22 Mar 21 Mar 20
Final
Final Final(rst)
Final Final(rst)
Minority Int - - - - 28 - 37
2 491
AttInc -19 6 230 -514 -21 Turnover 3 059 3 125 3 145 2 429 - 1 748
Op Inc
529
179
531
491
TotCompIncLoss - 24 - 11 132 - 541 - 18 NetIntPd(Rcvd) 42 24 16 10 14
Fixed Ass - - - 35 85
73
Inv & Loans - - - 12 256 Minority Int 109 123 138 36 - 1 888
255
283
Att Inc
72
225
Tot Curr Ass 40 64 90 128 297
378
100
414
334
Ord SH Int 34 57 69 - 63 450 TotCompIncLoss 1 055 1 058 1 067 1 082 - 1 820
Fixed Ass
925
Minority Int - - - - 64 - 36 Tot Curr Ass 2 297 1 758 1 786 1 574 1 606
LT Liab - - 1 - 6 Ord SH Int 2 857 2 802 2 753 2 635 2 618
Tot Curr Liab 7 7 22 311 346
Minority Int 1 313 1 288 1 244 1 109 1 075
PER SHARE STATISTICS (cents per share) LT Liab 1 084 970 864 927 875
HEPS-C (ZARc) - 1.72 0.51 - 1.53 - 34.01 4.96 Tot Curr Liab 866 571 752 786 830
NAV PS (ZARc) 3.07 5.21 6.22 - 5.70 40.77 PER SHARE STATISTICS (cents per share)
3 Yr Beta - 0.83 0.68 0.70 - 0.44 HEPS-C (ZARc) 50.68 57.33 64.21 21.08 34.34
Price High 12 12 12 22 37 DPS (ZARc) 34.00 41.00 47.00 14.00 21.00
Price Low 12 12 12 7 10
Price Prd End 12 12 12 12 14 NAV PS (ZARc) 645.00 615.00 622.00 595.00 591.00
0.54
3 Yr Beta
0.37
1.09
0.52
0.26
RATIOS
Price High 407 550 500 550 450
Ret on SH Fnd - 56.05 9.76 335.35 425.96 - 13.99 Price Low 310 331 251 237 234
Oper Pft Mgn - 52.03 30.13 579.59 - 56.09 - 3.85 Price Prd End 326 361 398 295 320
D:E 0.04 0.03 0.03 - 1.65 0.50
Current Ratio 5.51 9.44 4.15 0.41 0.86 RATIOS
Ret on SH Fnd 8.01 9.23 10.53 2.88 - 49.14
Oper Pft Mgn 16.05 17.00 16.81 7.36 - 70.15
D:E 0.29 0.26 0.24 0.30 0.31
Current Ratio 2.65 3.08 2.38 2.00 1.94
Div Cover(EPS) 1.49 1.40 1.36 1.16 - 20.28
109