
Page 204 - Profile's Stock Exchange Handbook - 2025 Issue 3
P. 204
JSE - TEX Profile’s Stock Exchange Handbook: 2025 - Issue 3
Texton Property Fund Ltd. Tharisa plc
ISIN: ZAE000190542 SHORT: TEX CODE: TEX ISIN: CY0103562118 SHORT: THARISA CODE: THA
REG NO: 2005/019302/06 FOUNDED: 2011 LISTED: 2011 REG NO: HE223412 FOUNDED: 2006 LISTED: 2014
NATURE OF BUSINESS: Texton is a JSE-listed Real Estate Investment NATURE OF BUSINESS: Tharisa is an integrated resource group
Trust (“REIT”) that offers shareholders direct access to its high- critical to the energy transition and decarbonisation of economies. It
quality property portfolio. Texton’s portfolio is valued at R2.1 billion incorporates mining, processing, exploration and the beneficiation,
as at 30 June 2024 (2023: R2.2 billion) and aims to deliver long- marketing, sales, and logistics of Platinum Group Metals (PGMs) and
term income and capital growth. Texton is focused on investing in chrome concentrates, using innovation and technology as enablers.
high-quality properties in centralised nodes in both SA and the UK The Company is committed to reducing its carbon emissions by
across office, industrial and retail properties. 30% by 2030 and the development of a roadmap to become net
SECTOR: RealEstate--RealEstate--REITS--Office carbon neutral by 2050.
NUMBER OF EMPLOYEES: 19 SECTOR: Basic Materials--Basic Resrcs--Ind Met & Min--General
DIRECTORS: Franco R A (ne), Hannington A J (snr ind ne), Mining
van der Vent W C (ind ne), Golding M J A (Chair, ne), Rens J (CEO), NUMBER OF EMPLOYEES: 4 879
Welleman H S P (CFO), Macey J (ld ind ne) DIRECTORS: Bell C (ld ind ne), Chen H (ne), Davey R (ind ne, UK),
MAJOR ORDINARY SHAREHOLDERS as at 14 Feb 2025 Kamal O M (ind ne), Lo S W M (ne, China), Salter Dr J D (ld ind ne, UK),
Oak Tech Trading (Pty) Ltd. 29.45% Zvaravanhu G (ind ne), Pouroulis L C (Chair), Pouroulis P (CEO),
Thibault REIT Ltd. 22.77% Jones M G (CFO)
Kloof Capital South Africa (Pty) Ltd. 14.30% MAJOR ORDINARY SHAREHOLDERS as at 30 Sep 2024
POSTAL ADDRESS: PO Box 653129, Benmore, 2010 Medway Developments Ltd. 40.75%
MORE INFO: www.sharedata.co.za/sdo/jse/TEX Rance Holdings Ltd. 12.73%
COMPANY SECRETARY: CorpStat Governance Services (Pty) Ltd. Fujian Wuhang Stainless Steel Co Ltd. 8.84%
TRANSFER SECRETARY: Computershare Investor Services (Pty) Ltd. POSTAL ADDRESS: PO Box 62425, Paphos, Cyprus, 8064
SPONSOR: Investec Bank Ltd. MORE INFO: www.sharedata.co.za/sdo/jse/THA
AUDITORS: BDO South Africa Inc. COMPANY SECRETARY: Lysandros Lysandrides, Sanet Findlay
CAPITAL STRUCTURE Authorised Issued TRANSFER SECRETARY: Computershare Investor Services (Pty) Ltd.
TEX Ords of no par 2 000 000 000 330 059 664 SPONSOR: Investec Bank Ltd.
AUDITORS: BDO Cyprus
DISTRIBUTIONS [ZARc] CAPITAL STRUCTURE Authorised Issued
Ords of no par Ldt Pay Amt THA Ords USD0.001 10 000 000 000 302 596 743
Share Premium No 1 20 May 25 26 May 25 79.87
Special No 1 20 May 25 26 May 25 20.13 DISTRIBUTIONS [USDc]
LIQUIDITY: Jul25 Avg 268 215 shares p.w., R1.0m(4.2% p.a.) Ords USD0.001 Ldt Pay Amt
Interim No 16 10 Jun 25 25 Jun 25 1.50
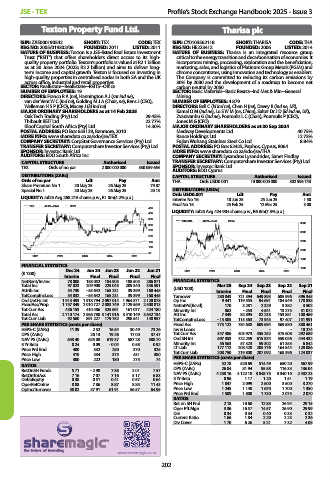
TEX 40 Week MA REIV Final No 15 25 Feb 25 12 Mar 25 3.00
450
LIQUIDITY: Jul25 Avg 424 904 shares p.w., R6.8m(7.3% p.a.)
400
350
THARISA 40 Week MA INDM
3500
300
250 3000
200
2500
150
100
2000
50
2021 2022 2023 2024 2025
1500
FINANCIAL STATISTICS
Dec 24 Jun 24 Jun 23 Jun 22 Jun 21 2021 2022 2023 2024 2025 1000
(R ’000)
Interim Final Final Final Final
NetRent/InvInc 78 008 158 052 184 905 188 505 286 871 FINANCIAL STATISTICS
Total Inc 97 023 209 900 225 045 209 340 346 591 Mar 25 Sep 24 Sep 23 Sep 22 Sep 21
Attrib Inc 54 730 - 55 642 165 231 39 399 160 445 (USD ’000) Interim Final Final Final Final
TotCompIncLoss 54 832 - 55 642 165 231 39 399 160 445 Turnover 280 843 721 394 649 893 685 996 596 345
Ord UntHs Int 1 913 493 1 918 794 2 097 014 1 964 371 2 120 078 Op Inc 9 441 119 555 94 691 184 549 178 838
FixedAss/Prop 1 757 349 2 010 727 2 083 749 2 129 569 2 508 813 NetIntPd(Rcvd) 170 3 281 2 329 3 382 3 502
Tot Curr Ass 436 153 410 486 325 691 161 077 424 180 Minority Int 862 - 253 4 541 13 275 31 072
Total Ass 2 710 174 2 966 788 3 141 916 3 410 149 3 642 134 Att Inc 7 349 82 895 82 235 153 881 100 469
Tot Curr Liab 92 560 891 227 179 752 298 541 148 957 TotCompIncLoss - 15 385 115 363 73 945 97 407 151 991
PER SHARE STATISTICS (cents per share) Fixed Ass 773 122 784 638 609 694 569 580 380 461
HEPS-C (ZARc) 11.39 2.52 16.54 30.49 73.26 Inv & Loans - - - - 10 274
DPS (ZARc) - 20.13 19.26 17.00 37.47 Tot Curr Ass 347 486 403 973 455 252 375 608 292 689
NAV PS (ZARc) 643.40 625.08 619.37 587.28 588.70 Ord SH Int 697 353 722 259 615 874 559 026 444 432
3 Yr Beta 0.24 0.09 - 0.04 0.58 0.92 Minority Int 56 563 57 323 59 302 61 355 6 842
Price Prd End 400 332 250 370 325 LT Liab 177 112 208 420 205 776 164 544 128 086
168 396
219 800
208 750
124 037
207 092
Tot Curr Liab
Price High 410 334 375 431 380
Price Low 300 222 180 275 74 PER SHARE STATISTICS (cents per share)
RATIOS HEPS-C (ZARc) 52.78 520.69 514.49 650.20 567.99
RetOnSH Funds 5.71 - 2.90 7.88 2.01 7.57 DPS (ZARc) 26.84 81.94 95.58 116.33 136.04
RetOnTotAss 7.16 7.07 7.16 5.17 6.83 NAV PS (ZARc) 4 238.16 4 122.18 3 848.75 3 340.10 2 432.23
Debt:Equity 0.38 0.51 0.41 0.57 0.64 3 Yr Beta 0.96 1.17 1.20 1.51 1.19
OperRetOnInv 8.88 7.86 8.87 8.85 11.43 Price High 1 847 2 099 2 600 3 500 3 270
OpInc:Turnover 58.02 57.91 61.91 56.57 64.95 Price Low 1 245 1 140 1 670 1 700 1 350
Price Prd End 1 509 1 800 1 730 2 075 2 070
RATIOS
Ret on SH Fnd 2.18 10.60 12.85 26.94 29.15
Oper Pft Mgn 3.36 16.57 14.57 26.90 29.99
D:E 0.34 0.34 0.40 0.33 0.32
Current Ratio 1.66 1.84 2.20 2.23 2.36
Div Cover 1.70 6.26 5.21 7.32 4.08
202