
Page 200 - Profile's Stock Exchange Handbook - 2025 Issue 3
P. 200
JSE - STE Profile’s Stock Exchange Handbook: 2025 - Issue 3
Stefanutti Stocks Holdings Ltd. Stor-Age Property REIT Ltd.
ISIN: ZAE000123766 SHORT: STEFSTOCK CODE: SSK ISIN: ZAE000208963 SHORT: STOR-AGE CODE: SSS
REG NO: 1996/003767/06 FOUNDED: 1971 LISTED: 2007 REG NO: 2015/168454/06 FOUNDED: 2005 LISTED: 2015
NATURE OF BUSINESS: Stefanutti Stocks is a multidisciplinary NATURE OF BUSINESS: Stor-Age is one of only 111 publicly traded
construction group that delivers projects, of any scale, to diverse self storage Real Estate Investment Trusts (REITs) globally, Stor-Age
sectors in the built environment. The group’s geographical is the leading and largest self storage property fund and brand in
footprint spans South Africa and other sub-Saharan African South Africa, and the first and only self storage REIT listed on any
countries where its mission is to deliver exceptional engineering emerging market exchange. In November 2017, Stor-Age entered
solutions that enrich people’s lives. the United Kingdom (UK) with the strategic acquisition of Storage
SECTOR: Inds--Constr&Mats--Constr&Mats--Construction King – the sixth largest self storage brand in the UK2. The portfolio
NUMBER OF EMPLOYEES: 5 507 across both markets includes a total of 103 properties.
DIRECTORS: Craig H (ind ne), Harie B (ind ne), Silwanyana B (ind ne), SECTOR: RealEstate--RealEstate--REITs--Storage REITs
Matlala Z (Chair, ind ne), Crawford R (CEO), du Plessis Y (CFO) NUMBER OF EMPLOYEES: 480
MAJOR ORDINARY SHAREHOLDERS as at 28 Feb 2025 DIRECTORS: Chapman J (ld ind ne), de Kock K (ind ne), Horton S,
M J Schwegmann 11.03% Koranteng A A (ind ne), Menigo A (ind ne), Morojele M (ind ne),
Stefanutti Stocks Investments (Pty) Ltd. 7.66% Varachhia A (ind ne), Blackshaw G (Chair, ne), Lucas G (CEO),
The Windsor Drive Property Trust 5.82% Lucas S (FD)
POSTAL ADDRESS: Private Bag X2032, Isando, 1600 MAJOR ORDINARY SHAREHOLDERS as at 20 Jun 2025
MORE INFO: www.sharedata.co.za/sdo/jse/SSK Public Investment Corporation 20.18%
COMPANY SECRETARY: William Somerville Coronation Asset Management (Pty) Ltd. 10.22%
TRANSFER SECRETARY: Computershare Investor Services (Pty) Ltd. Old Mutual Investment Group (Pty) Ltd. 10.04%
SPONSOR: Bridge Capital Advisors (Pty) Ltd. POSTAL ADDRESS: PO Box 53154, Kenilworth, Cape Town, 7745
AUDITORS: Forvis Mazars MORE INFO: www.sharedata.co.za/sdo/jse/SSS
CAPITAL STRUCTURE Authorised Issued COMPANY SECRETARY: Henry Steyn
SSK Ords 0.00025c ea 400 000 000 188 080 746 TRANSFER SECRETARY: Computershare Investor Services (Pty) Ltd.
SPONSOR: Investec Bank Ltd.
DISTRIBUTIONS [ZARc] AUDITORS: BDO Inc.
Ords 0.00025c ea Ldt Pay Amt CAPITAL STRUCTURE Authorised Issued
Final No 7 29 Jun 12 9 Jul 12 12.00 SSS Ords no par value 1 000 000 000 481 663 273
Interim No 6 2 Dec 11 12 Dec 11 12.00
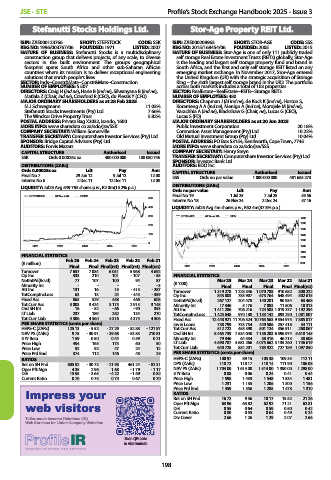
LIQUIDITY: Jul25 Avg 549 763 shares p.w., R2.0m(15.2% p.a.) DISTRIBUTIONS [ZARc]
Ords no par value Ldt Pay Amt
STEFSTOCK 40 Week MA CONM Final No 19 1 Jul 25 7 Jul 25 53.56
500
Interim No 18 26 Nov 24 2 Dec 24 57.16
400 LIQUIDITY: Jul25 Avg 4m shares p.w., R52.4m(37.8% p.a.)
300 STOR-AGE 40 Week MA REIV
1700
1600
200
1500
100 1400
1300
0
2021 2022 2023 2024 2025 1200
1100
FINANCIAL STATISTICS 1000
Feb 25 Feb 24 Feb 23 Feb 22 Feb 21
(R million) 900
Final Final Final(rst) Final(rst) Final(rst) 2021 2022 2023 2024 2025
Turnover 7 657 7 084 6 051 5 968 4 692
Op Inc 333 210 101 - 107 - 55 FINANCIAL STATISTICS
NetIntPd(Rcvd) 77 107 100 94 87 Mar 25 Mar 24 Mar 23 Mar 22 Mar 21
Minority Int - - - - - 3 (R ’000) Final Final Final Final Final(rst)
Att Inc 131 16 15 - 415 - 287 Turnover 1 319 278 1 228 346 1 070 788 910 682 800 222
TotCompIncLoss 63 13 24 - 443 - 359 Op Inc 843 803 783 907 673 764 648 494 502 615
Fixed Ass 865 529 458 466 608 NetIntPd(Rcvd) 267 127 204 478 140 201 90 934 63 468
Tot Curr Ass 3 003 3 424 3 175 2 913 3 148 Minority Int 17 346 5 176 7 083 11 506 10 313
Ord SH Int 16 - 52 - 66 - 90 353 Att Inc 1 411 286 706 216 724 583 1 019 737 1 192 294
LT Liab 237 189 262 134 270 TotCompIncLoss 1 425 648 970 188 1 133 142 893 290 1 081 807
Tot Curr Liab 4 306 4 560 4 316 4 375 4 506 Fixed Ass 12 448 921 11 706 324 10 763 563 9 554 975 7 885 017
PER SHARE STATISTICS (cents per share) Inv & Loans 738 799 733 754 449 586 257 418 34 111
HEPS-C (ZARc) 125.13 - 5.52 - 27.29 - 82.88 - 121.87 Tot Curr Ass 512 722 455 390 501 124 356 911 260 067
NAV PS (ZARc) 9.75 - 30.91 - 39.68 - 53.83 210.81 Ord SH Int 8 465 739 7 534 040 7 136 203 6 596 974 5 618 145
3 Yr Beta 1.59 0.50 0.44 0.59 0.21 Minority Int 79 346 64 554 58 416 46 213 38 608
Price High 494 165 175 60 50 LT Liab 4 690 787 4 681 266 4 075 662 3 135 260 1 746 619
Price Low 92 92 47 24 12 Tot Curr Liab 640 725 834 201 785 922 727 189 1 097 850
Price Prd End 374 112 146 48 25 PER SHARE STATISTICS (cents per share)
RATIOS HEPS-C (ZARc) 100.97 89.15 105.38 109.35 112.11
Ret on SH Fnd 805.92 - 30.73 - 21.98 461.24 - 82.31 DPS (ZARc) 110.72 118.17 118.14 111.90 106.08
Oper Pft Mgn 4.35 2.96 1.68 - 1.79 - 1.17 NAV PS (ZARc) 1 704.00 1 614.00 1 514.00 1 390.00 1 298.00
D:E 15.95 - 3.65 - 4.22 - 1.69 0.82 3 Yr Beta 0.08 0.06 0.24 0.41 0.44
Current Ratio 0.70 0.75 0.74 0.67 0.70 Price High 1 598 1 433 1 548 1 534 1 481
Price Low 1 231 1 135 1 206 1 300 1 156
Price Prd End 1 459 1 356 1 285 1 478 1 310
Impress your RATIOS 16.72 9.36 10.17 15.52 21.26
Impr
our
ess y
Ret on SH Fnd
b visitor
w
e
s
web visitors Oper Pft Mgn 63.96 63.82 62.92 71.21 62.81
0.50
0.64
0.59
D:E
0.42
0.55
0.24
0.49
0.80
Current Ratio
0.64
0.55
Tailor-made Investor Relations (IR) Div Cover 2.66 1.26 1.29 2.07 2.66
Web Services for Listed Company Websites
Scan QR code
to visit website
198