
Page 177 - Profile's Stock Exchange Handbook - 2025 Issue 3
P. 177
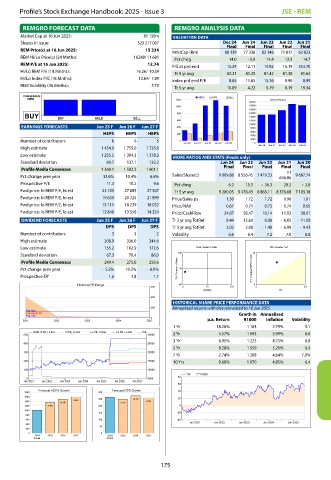
Profile’s Stock Exchange Handbook: 2025 - Issue 3                         JSE - REM

        REMGRO FORECAST DATA                       REMGRO ANALYSIS DATA
       Market Cap at 16 Jun 2025:         81 150m  VALUATION DATA
       Shares in issue:                  529 217 007            Dec 24  Jun 24  Jun 23  Jun 22  Jun 21
                                                                 Final  Final  Final  Final  Final
       REM Price(c) at 16 Jun 2025:         15 334  MrktCap (Rm)    88 139    77 336    82 146    71 817   63 823
       REM Hi/Lo Price(c) (24 Mnths):   1 6248/ 11 681  Pct chng   14.0  - 5.9   14.4   12.5   14.7
       REM P/E at 16 Jun 2025:               12.74  P/E at prd end   15.24   12.11   14.82   15.19   353.70
       Hi/Lo REM P/E (18 Mnths):         16.26/  10.39  Tr 5 yr avg   82.21   81.25   81.42   81.38   81.64
       Hi/Lo Index P/E (18 Mnths):        13.64/  7.89  Index prd end P/E   8.65   11.65   15.26   9.90   8.99
       REM Volatility (36 Mnths):             3.70  Tr 5 yr avg   10.89   4.22   5.79   8.19   19.34
        CONSENSUS                                        HEPS  DPS  (ZARc)
         VIEW                                      1200                       NAV (ZAR/cps)
                                                                        22000
                                                   1000                 20000
                                                                        18000
        BUY                                        800                  16000
                                                                        14000
                            HOLD
                 BUY
                                       SELL
                                                   600                  12000
                                                                        10000
       EARNINGS FORECASTS   Jun 25 F  Jun 26 F  Jun 27 F  400           8000
                              HEPS   HEPS  HEPS    200                  6000
                                                                        4000
       Number of contributors    6     6      5     0                   2000
                                                     Jun 20  Jun 21  Jun 22  Jun 23  Jun 24  0
       High estimate           1 454.0   1 755.0   1 735.0                Jun 20  Jun 21  Jun 22  Jun 23  Jun 24
       Low estimate            1 235.5   1 304.3   1 378.3  MORE RATIOS AND STATS (Finals only)
       Standard deviation        69.7    137.1    132.2         Jun 24  Jun 23  Jun 22  Jun 21  Jun 20
                                                                 Final  Final  Final  Final  Final
       Profile Media Consensus   1 360.1   1 502.2   1 601.1                       11
       Pct change prev year     33.6%    10.4%    6.6%  Sales/Share(c)   9 089.88  8 556.45  7 419.33  646.86   9 687.74
       Prospective P/E           11.3    10.2    9.6  Pct chng     6.2    15.3  -  36.3    20.2  -  3.8
       Fwd price: hi REM P/E, hi est   23 103   27 885   27 567  Tr 5 yr avg   9 280.05  9 476.43  8 863.11  8 376.68  7 103.18
       Fwd price: hi REM P/E, lo est   19 630   20 725   21 899  Price/Sales ps    1.50    1.72    1.72    0.96    1.01
       Fwd price: lo REM P/E, hi est   15 111   18 239   18 032  Price/NAV    0.67    0.71    0.73    0.74    0.65
       Fwd price: lo REM P/E, lo est   12 840   13 556   14 324  Price/CashFlow    24.67    58.47    10.14    11.93    30.01
       DIVIDEND FORECASTS   Jun 25 F  Jun 26 F  Jun 27 F  Tr 3 yr avg TotRet    8.44    15.60    0.08  -  6.05  -  11.08
                               DPS   DPS    DPS   Tr 5 yr avg TotRet    2.02    2.08  -  1.48  -  6.99  -  9.43
       Number of contributors    3     3      2   Volatility       6.6    6.4    7.2    7.0    6.8
       High estimate            308.9    336.0    344.6
       Low estimate             155.2    162.9    172.6  Risk / Return Profile  PEG Inverse 1.64
                                                    140                  30
       Standard deviation        67.3    79.4    86.0
       Profile Media Consensus    249.4    275.0    258.6
       Pct change prev year   -  5.5%    10.3%  -  6.0%  3Yr Compound Return  30  5 Yr Average HEPS Growth
       Prospective DY            1.6    1.8    1.7
                       Historical PE Range          -80                  0
                                            600      0      75    150     0            30
                                                           Volatility           P/E
                                            400
                                                  HISTORICAL SHARE PRICE PERFORMANCE DATA
                                            200   Annualised returns with divs reinvested to 16 Jun 2025
        Avg High
        Average 67.49                                                Grwth in  Annualised
        Avg Low
                                            0               p.a. Return  R1000  Inflation  Volatility
        2021    2022     2023     2024     2025
                                                  1 Yr         18.28%   1 183  2.79%    5.1
           REM Hi PE, Hi Est  Hi PE, Lo Est  Lo PE, Hi Est  Lo PE, Lo Est  P/E
        500                                30000  2 Yr         4.57%    1 093  3.99%    6.8
                                                  3 Yr         6.95%    1 223  4.75%    6.8
        400                                25000
                                                  5 Yr         9.28%    1 559  5.20%    6.4
        300                                20000
                                                  7 Yr         2.74%    1 208  4.64%   7.0%
        200                                15000  10 Yrs       0.68%    1 070  4.85%    6.4
        100                                10000
                                                      TRI  REM
                                                    80
         0                                 5000
        Jan 2021  Jan 2022  Jan 2023  Jan 2024  Jan 2025  Jan 2026  Jan 2027
                                                    60
            Forecast HEPS Growth  Forecast DPS Growth  40
        1800                 300
        1600
                             250       10.3%        20
        1400      10.4%    6.6%    -5.5%    -6.0%

        1200  33.6%          200                    0
        1000
                             150                   -20
        800
        600                  100                   -40  Jan 2021  Jan 2022  Jan 2023  Jan 2024  Jan 2025
        400
                             50
        200
         0                    0
           2024  2025  2026  2027  2024  2025  2026  2027
           Actual              Actual
                                               175