
Page 172 - Profile's Stock Exchange Handbook - 2025 Issue 3
P. 172
JSE - RAN Profile’s Stock Exchange Handbook: 2025 - Issue 3
Randgold & Exploration Co Ltd. Raubex Group Ltd.
ISIN: ZAE000008819 SHORT: RANGOLD CODE: RNG ISIN: ZAE000093183 SHORT: RAUBEX CODE: RBX
REG NO: 1992/005642/06 FOUNDED: 1992 LISTED: 1993 REG NO: 2006/023666/06 FOUNDED: 1974 LISTED: 2007
NATURE OF BUSINESS: Randgold & Exploration Company Ltd. (R&E) NATURE OF BUSINESS: Raubex is one of South Africa’s leading
is a company that invests its cash reserves and currently pursues infrastructure development and construction materials supply
legal claims. R&E was incorporated in South Africa as a public groups. Established in 1974, Raubex listed on the JSE in March 2007
company on 29 September 1992 to take over the gold interests of and operates throughout southern Africa and Western Australia. As
Rand Mines Ltd., being South Africa’s oldest mining house. a Level 1 B-BBEE Group, Raubex has over 8 276 employees and is
SECTOR: Basic Materials--Basic Resrcs--Precious Met & Min--Gold Min focused on ensuring high levels of integrity, professionalism and
NUMBER OF EMPLOYEES: 0 quality in all of its work.
DIRECTORS: Steyn M (CEO & FD), Burton P E (ind ne), Dube T S (ind ne), SECTOR: Inds--Constr&Mats--Constr&Mats--Construction
Gischen H, Kesler J M (ne), Fehrsen R J (Chair, ind ne) NUMBER OF EMPLOYEES: 8 276
MAJOR ORDINARY SHAREHOLDERS as at 31 Dec 2024 DIRECTORS: Bogatsu S R (ld ind ne), Fubu N (ind ne), Hlobo Dr M
Zerbans Cake & Coffee Shop CC 28.56% (ind ne), Kent B H (ind ne), Ndese M Z (ind ne), Fourie R J (Chair, ne),
Pacol Investments (Pty) Ltd. 22.77% Msiza N F (CEO), Lourens D (COO), Odendaal S (FD)
Mar Holdings (Pty) Ltd. 8.60% MAJOR ORDINARY SHAREHOLDERS as at 15 May 2025
POSTAL ADDRESS: PO Box 202, Stellenbosch, 7600 Public Investment Company SOC Ltd. 30.63%
MORE INFO: www.sharedata.co.za/sdo/jse/RNG Old Mutual Ltd. 25.90%
COMPANY SECRETARY: Statucor (Pty) Ltd. PSG 7.20%
TRANSFER SECRETARY: Computershare Investor Services (Pty) Ltd. POSTAL ADDRESS: PO Box 3722, Bloemfontein, 9300
SPONSOR: PSG Capital (Pty) Ltd. MORE INFO: www.sharedata.co.za/sdo/jse/RBX
AUDITORS: KPMG Inc. COMPANY SECRETARY: Grace Chemaly
CAPITAL STRUCTURE Authorised Issued TRANSFER SECRETARY: Computershare Investor Services (Pty) Ltd.
RNG Ords 1c ea 105 000 000 74 585 065 SPONSOR: Investec Bank Ltd.
AUDITORS: PwC Inc.
DISTRIBUTIONS [ZARc] CAPITAL STRUCTURE Authorised Issued
Ords 1c ea Ldt Pay Amt RBX Ords 1c ea 500 000 000 181 750 036
Special No 2 18 Jul 14 28 Jul 14 225.00
Share Premium No 1 7 Jan 11 17 Jan 11 253.81 DISTRIBUTIONS [ZARc]
LIQUIDITY: Jul25 Avg 26 609 shares p.w., R20 147.0(1.9% p.a.) Ords 1c ea Ldt Pay Amt
Final No 66 17 Jun 25 23 Jun 25 104.00
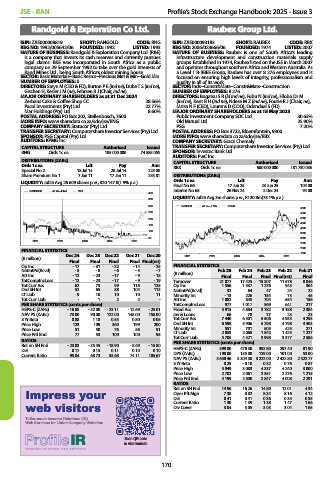
RANGOLD 40 Week MA MINI Interim No 65 26 Nov 24 2 Dec 24 94.00
400
LIQUIDITY: Jul25 Avg 3m shares p.w., R120.8m(73.1% p.a.)
350
300 RAUBEX 40 Week MA CONM
6000
250 5500
200 5000
4500
150
4000
100 3500
50 3000
2021 2022 2023 2024 2025
2500
2000
FINANCIAL STATISTICS
Dec 24 Dec 23 Dec 22 Dec 21 Dec 20 2021 2022 2023 2024 2025 1500
(R million)
Final Final Final Final Final(rst)
Op Inc - 17 - 31 - 22 - 14 - 25 FINANCIAL STATISTICS
NetIntPd(Rcvd) - 5 - 8 - 6 - 5 - 7 Feb 25 Feb 24 Feb 23 Feb 22 Feb 21
Att Inc - 12 - 23 - 17 - 9 - 18 (R million) Final Final Final Final(rst) Final
TotCompIncLoss - 12 - 23 - 17 - 9 - 19 Turnover 21 077 17 425 15 307 11 578 8 846
Tot Curr Ass 62 75 99 116 125 Op Inc 1 556 1 537 1 276 945 364
Ord SH Int 52 65 88 104 113 NetIntPd(Rcvd) 32 64 47 24 22
LT Liab 9 10 10 10 11 Minority Int - 13 226 154 73 45
Tot Curr Liab - 1 2 2 - Att Inc 1 082 848 704 554 158
PER SHARE STATISTICS (cents per share) TotCompIncLoss 977 1 017 969 641 217
HEPS-C (ZARc) - 16.88 - 32.00 - 23.11 - 12.69 - 25.01 Fixed Ass 5 915 4 884 3 782 3 188 2 384
NAV PS (ZARc) 73.00 90.00 122.00 145.00 158.00 Inv & Loans 66 78 77 23 23
3 Yr Beta 0.88 1.18 0.55 0.80 0.05 Tot Curr Ass 7 440 6 301 5 506 4 953 4 293
Price High 123 109 360 199 200 Ord SH Int 6 598 5 906 5 298 4 798 4 403
Price Low 51 50 76 56 91 Minority Int 551 701 505 425 271
Price Prd End 77 53 100 100 95 LT Liab 2 053 2 068 1 542 1 425 1 227
5 705
Tot Curr Liab
3 377
3 998
4 521
2 586
RATIOS PER SHARE STATISTICS (cents per share)
Ret on SH Fnd - 23.03 - 35.45 - 18.90 - 8.69 - 15.80
D:E 0.17 0.15 0.11 0.10 0.10 HEPS-C (ZARc) 599.80 476.30 392.80 297.40 81.90
Current Ratio 95.04 68.73 53.68 74.11 185.67 DPS (ZARc) 198.00 155.00 129.00 101.00 53.00
NAV PS (ZARc) 3 630.46 3 304.30 3 222.00 2 422.80 2 422.77
3 Yr Beta 0.25 - 0.10 0.32 0.76 0.87
Price High 5 949 3 083 4 337 4 240 3 000
Price Low 2 702 2 061 2 351 2 276 1 215
Price Prd End 4 199 2 800 2 847 4 008 2 291
RATIOS 14.96 16.26 14.80 12.01 4.34
Ret on SH Fnd
Impr
ess y
our
Impress your Oper Pft Mgn 7.38 8.82 8.34 8.16 4.12
0.41
0.36
D:E
0.35
0.41
0.35
w e b visitor s Current Ratio 1.30 1.39 1.38 1.47 1.66
web visitors
3.04
1.65
3.03
3.05
Div Cover
3.04
Tailor-made Investor Relations (IR)
Web Services for Listed Company Websites
Scan QR code
to visit website
170