
Page 212 - Profile's Stock Exchange Handbook - 2025 Issue 2
P. 212
JSE – VUK Profile’s Stock Exchange Handbook: 2025 – Issue 2
Vukile Property Fund Ltd. Vunani Ltd.
VUK VUN
ISIN: ZAE000056370 SHORT: VUKILE CODE: VKE ISIN: ZAE000163382 SHORT: VUNANI CODE: VUN
REG NO: 2002/027194/06 FOUNDED: 2004 LISTED: 2004 REG NO: 1997/020641/06 FOUNDED: 1997 LISTED: 2007
NATURE OF BUSINESS: Vukile is a consumer-focused retail REIT with a NATURE OF BUSINESS: Vunani is an independent black-owned and
clear strategic direction, an unwavering focus on execution, and a managed diversified financial services group with a robust operational
well-defined roadmap for achieving future success and creating value for platform that supports an innovative and fully integrated range of products
stakeholders. and services. The company is owner-managed by professionals who have a
Vukile’s market capitalisation as at 31 March 2024 was R16.8 billion. passion for entrepreneurship and has solidified its position as one of the
SECTOR: RealEstate—RealEstate—REITS—Retail country’s leading boutique providers.
NUMBER OF EMPLOYEES: 82 SECTOR:Fins—FinServcs—InvBnkng&BrokerServcs—InvestmentServices
DIRECTORS: DongwanaNP(ind ne), Formby J (ind ne), NUMBER OF EMPLOYEES: 386
Zehner J (ind ne), Pottas L (FD), Rapp L (CEO), Mothibeli I, DIRECTORS: Anderson N M, GoldingMJA(ne), Khoza B M,
Payne N G (Chair, ind ne), Booysen Dr S F (Chair, ind ne), Macey J (ind ne), MazwiNS(ind ne), Mthethwa S (ne), Nzalo G (ind ne),
KodisangBM(ne), Mokate DrRD(ld ind ne), Mokgabudi T (ind ne), Jacobs L I (Chair, ind ne), Dube E G (Group CEO), Mika T (CFO)
Moseneke DrGS(ne) MAJOR ORDINARY SHAREHOLDERS as at 29 Feb 2024
MAJOR ORDINARY SHAREHOLDERS as at 15 Apr 2025 Bambelela Capital (Pty) Ltd. 49.20%
Public Investment Corporation SOC Ltd. 20.22% Geomer Investments (Pty) Ltd. 18.60%
Ninety One SA (Pty) Ltd. 5.03% POSTAL ADDRESS: PO Box 652419, Benmore, 2010
Eskom Pension and Provident Fund 4.97% MORE INFO: www.sharedata.co.za/sdo/jse/VUN
POSTAL ADDRESS: PO Box 2779, Saxonworld, 2132 COMPANY SECRETARY: CIS Company Secretaries (Pty) Ltd.
MORE INFO: www.sharedata.co.za/sdo/jse/VKE TRANSFER SECRETARY: Singular Systems (Pty) Ltd.
COMPANY SECRETARY: Johann Neethling SPONSOR: Vunani Sponsors
TRANSFER SECRETARY: JSE Investor Services (Pty) Ltd. AUDITORS: BDO South Africa Inc.
SPONSOR: Java Capital (Pty) Ltd.
AUDITORS: PwC Inc. CAPITAL STRUCTURE AUTHORISED ISSUED
VUN Ords no par value 500 000 000 161 155 915
CAPITAL STRUCTURE AUTHORISED ISSUED
VKE Ords no par 1 500 000 000 1 244 630 392 DISTRIBUTIONS [ZARc]
Ords no par value Ldt Pay Amt
DISTRIBUTIONS [ZARc] Final No 14 9 Jul 24 15 Jul 24 9.00
Ords no par Ldt Pay Amt Scr/100 Interim No 13 21 Nov 23 27 Nov 23 9.00
Interim No 41 10 Dec 24 17 Dec 24 55.18 3.07
Final No 40 25 Jun 24 1 Jul 24 72.18 - LIQUIDITY: Apr25 Avg 98 162 shares p.w., R174 626.0(3.2% p.a.)
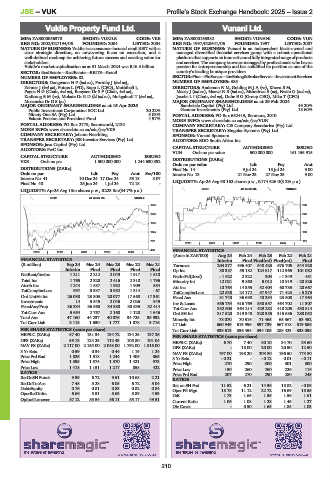
GENF 40 Week MA VUNANI
LIQUIDITY: Apr25 Avg 13m shares p.w., R223.8m(54.7% p.a.)
REIV 40 Week MA VUKILE
1955 263
1655 226
1356 190
1057 153
757 116
2020 | 2021 | 2022 | 2023 | 2024 |
458 FINANCIAL STATISTICS
2020 | 2021 | 2022 | 2023 | 2024 |
(Amts in ZAR’000) Aug 24 Feb 24 Feb 23 Feb 22 Feb 21
FINANCIAL STATISTICS Interim Final Final(rst) Final(rst) Final
(R million) Sep 24 Mar 24 Mar 23 Mar 22 Mar 21 Turnover 204 377 496 407 548 423 676 705 544 928
Interim Final Final Final Final Op Inc 38 387 55 182 124 617 112 965 101 082
NetRent/InvInc 1 211 2 212 2 049 1 917 1 510 NetIntPd(Rcvd) - 1 622 2 322 304 - 1 349 451
Total Inc 1 765 2 328 2 416 2 310 1 796 Minority Int 12 021 9 860 5 012 10 919 - 20 826
Attrib Inc 1 244 1 587 1 932 1 909 584 Att Inc 10 764 14 355 52 404 60 785 20 667
TotCompIncLoss 997 3 337 3 952 1 314 - 67 TotCompIncLoss 22 538 24 172 57 947 71 423 - 5 273
Ord UntHs Int 26 038 23 803 20 077 17 568 17 361 Fixed Ass 31 740 36 690 40 294 23 508 17 964
Investments 14 3 545 2 046 2 026 949 Inv & Loans 685 754 616 769 530 557 464 702 11 307
FixedAss/Prop 36 334 36 568 34 380 30 535 32 414 Tot Curr Ass 352 603 364 214 429 282 418 205 430 814
Tot Curr Ass 5 654 2 767 2 168 1 128 1 646 Ord SH Int 317 520 319 348 328 385 315 686 280 052
Total Ass 47 160 44 237 40 076 34 725 35 992 Minority Int 78 070 70 516 71 465 65 367 53 452
Tot Curr Liab 3 118 1 630 1 777 1 878 3 716 LT Liab 660 949 619 996 597 739 567 318 519 686
PER SHARE STATISTICS (cents per share) Tot Curr Liab 333 613 336 454 334 105 288 423 338 098
HEPS-C (ZARc) 87.40 131.34 134.72 134.25 137.26 PER SHARE STATISTICS (cents per share)
DPS (ZARc) 55.18 124.25 112.43 105.80 101.04 HEPS-C (ZARc) 6.70 7.40 30.10 34.70 33.60
NAV PS (ZARc) 2 117.00 2 155.00 2 048.00 1 792.00 1 816.00 DPS (ZARc) - 18.00 20.00 20.50 12.50
3 Yr Beta 0.59 0.34 0.44 1.19 1.24 NAV PS (ZARc) 197.00 198.20 203.80 196.50 173.80
Price Prd End 1 826 1 518 1 244 1 406 865 3 Yr Beta - 0.21 - - 0.12 0.01 - 0.11
Price High 1 895 1 574 1 570 1 421 973 Price High 270 290 300 301 300
Price Low 1 418 1 151 1 217 858 422 Price Low 150 260 260 226 116
RATIOS Price Prd End 207 270 290 280 245
RetOnSH Funds 9.59 6.72 9.51 10.68 2.21 RATIOS
RetOnTotAss 7.48 5.28 6.05 6.72 5.04 Ret on SH Fnd 11.52 6.21 14.36 18.82 - 0.05
Debt:Equity 0.76 0.81 0.83 0.82 0.84 Oper Pft Mgn 18.78 11.12 22.72 16.69 18.55
OperRetOnInv 6.66 5.51 5.63 5.89 4.53 D:E 1.73 1.65 1.55 1.56 1.61
OpInc:Turnover 57.12 55.54 56.11 55.17 49.51 Current Ratio 1.06 1.08 1.28 1.45 1.27
Div Cover - 0.50 1.65 1.85 1.03
210