
Page 217 - Profile's Stock Exchange Handbook - 2025 Issue 2
P. 217
Profile’s Stock Exchange Handbook: 2025 – Issue 2 JSE – ZED
Zeder Investments Ltd.
ZED
ISIN: ZAE000088431 SHORT: ZEDER CODE: ZED
REG NO: 2006/019240/06 FOUNDED: 2006 LISTED: 2006
NATUREOF BUSINESS:Zederisaninvestorinthebroadagribusinessand
related industries. The company listed on the Johannesburg Stock
Exchange on 6 December 2006, as at 28 February 2024, Zeder’s
investment portfolio was valued at approximately R3.82bn.
SECTOR: Fins—FinServcs—InvBnkng&BrokerServcs—AssMgrs&Custodians
NUMBER OF EMPLOYEES: 2
DIRECTORS: le Roux J (CEO & FD), Cassiem S (ind ne), Greeff W L (ne),
Mjoli-Mncube N S (ld ind ne), Mouton P J (ne), Otto C A (Chair, ind ne)
MAJOR ORDINARY SHAREHOLDERS as at 17 Sep 2024
PSG Financial Services Ltd. 48.60%
Peresec Prime Brokers (Pty) Ltd. 10.13%
Coronation Asset Management Holdings (Pty) Ltd. 6.30%
POSTAL ADDRESS: PO Box 7403, Stellenbosch, 7599
MORE INFO: www.sharedata.co.za/sdo/jse/ZED
COMPANY SECRETARY: Zeder Corporate Services (Pty) Ltd.
TRANSFER SECRETARY: Computershare Investor Services (Pty) Ltd.
SPONSORS: BSM Sponsors (Pty) Ltd., PSG Capital (Pty) Ltd.
AUDITORS: Deloitte & Touche Inc.
CAPITAL STRUCTURE AUTHORISED ISSUED
ZED Ords no par 3 000 000 000 1 540 160 354
DISTRIBUTIONS [ZARc]
Ords no par Ldt Pay Amt
Special No 10 17 Dec 24 23 Dec 24 11.00
Special No 9 19 Nov 24 25 Nov 24 20.00
LIQUIDITY: Apr25 Avg 2m shares p.w., R3.7m(7.0% p.a.)
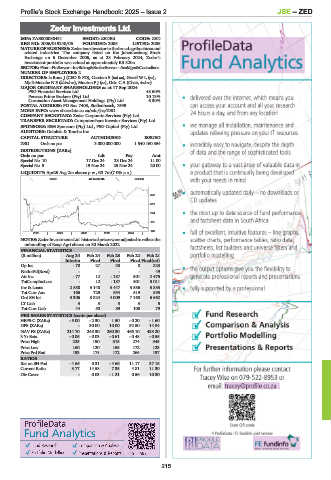
GENF 40 Week MA ZEDER
378
316
254
191
129
2020 | 2021 | 2022 | 2023 | 2024 |
NOTES: Zeder InvestmentsLtd.historical prices wereadjustedtoreflect the
unbundling of Kaap Agri shares on 30 March 2022.
FINANCIAL STATISTICS
(R million) Aug 24 Feb 24 Feb 23 Feb 22 Feb 21
Interim Final Final Final Final(rst)
Op Inc - 70 27 38 8 823
NetIntPd(Rcvd) - - - - 49
Att Inc - 77 12 - 187 801 2 475
TotCompIncLoss - 12 - 187 801 3 011
Inv & Loans 2 588 3 148 3 447 3 586 5 853
Tot Curr Ass 166 729 654 519 893
Ord SH Int 3 306 3 824 4 009 7 168 6 662
LT Liab 3 3 3 3 5
Tot Curr Liab 44 50 89 108 79
PER SHARE STATISTICS (cents per share)
HEPS-C (ZARc) - 5.00 - 2.30 1.50 - 0.20 - 1.60
DPS (ZARc) - 30.00 10.00 92.50 14.84
NAV PS (ZARc) 214.70 248.30 260.30 466.10 433.20
3 Yr Beta - 0.05 - 0.03 - 0.61 - 0.48 - 0.55
Price High 225 190 315 274 345
Price Low 160 120 155 172 123
Price Prd End 193 178 172 265 197
RATIOS
Ret on SH Fnd - 4.66 0.31 - 4.66 11.17 37.15
Current Ratio 3.77 14.58 7.35 4.81 11.30
Div Cover - 0.03 - 1.21 0.56 10.30
215