
Page 211 - Profile's Stock Exchange Handbook - 2025 Issue 2
P. 211
Profile’s Stock Exchange Handbook: 2025 – Issue 2 JSE – VIS
Visual International Holdings Ltd. Vodacom Group Ltd.
VIS VOD
ISIN: ZAE000187407 SHORT: VISUAL CODE: VIS ISIN: ZAE000132577 SHORT: VODACOM CODE: VOD
REG NO: 2006/030975/06 FOUNDED: 2006 LISTED: 2014 REG NO: 1993/005461/06 FOUNDED: 1993 LISTED: 2009
NATURE OF BUSINESS: Visual is a property development company, NATURE OF BUSINESS: Vodacom is a leading and purpose-driven African
which requires development funding and “patient” money. Due to operator which offers connectivity, digital and financial services to its
industry developments, the banking sector had been reticent to provide customers. Including Safaricom, the Group serves 203.1 million
development loans and also to provide end user finance to Visual’s target customers.
segment. However, although the approval processes took longer than SECTOR: Telecoms—Telecoms—TelecomServiceProvider—TelecomServices
expected, the Company finally generated revenue during the current year NUMBER OF EMPLOYEES: 13 687
from the development of The Marine, Strand. With City of Cape Town DIRECTORS: Bianco F (alt, It), Govinda S K (ne), Klotz P (ne),
approval of the building plans for Stellendale Junction and construction of Macozoma S (ld ind ne), Mahanyele-Dabengwa P (ind ne), Nqweni N (alt),
Phase 1, known as They Knysna finally underway, Visual is now getting Otty J (ne, UK), Reiter J (ne), Shuenyane K L (ld ind ne),
back to business. Thomson C B (ind ne), WoodL(ne), Joosub M S (CEO), Morathi R K (CFO)
SECTOR: AltX MAJOR ORDINARY SHAREHOLDERS as at 31 Mar 2024
NUMBER OF EMPLOYEES: 3 Vodafone Group plc 65.10%
DIRECTORS: Matlholwa L (ne), Vorster T (ind ne), Richards Dr R Government Employees Pension Fund 11.94%
(Chair, ind ne), Robertson C K (CEO), Kadalie R (Acting CFO) YeboYethu Investment Company (RF) (Pty) Ltd. 5.51%
MAJOR ORDINARY SHAREHOLDERS as at 03 Mar 2025 POSTAL ADDRESS: Private Bag X9904, Sandton, 2146
CKR Investment Trust 39.34% MORE INFO: www.sharedata.co.za/sdo/jse/VOD
RAL Trust 18.85% COMPANY SECRETARY: Karen Robinson
UJobs (Pty) Ltd. 13.36% TRANSFER SECRETARY: Computershare Investor Services (Pty) Ltd.
POSTAL ADDRESS: PO Box 3163, Tyger Valley, 7536 SPONSOR: Investec Bank Ltd.
MORE INFO: www.sharedata.co.za/sdo/jse/VIS AUDITORS: Ernst & Young
COMPANY SECRETARY: Light Consulting (Pty) Ltd.
TRANSFER SECRETARY: JSE Investor Services (Pty) Ltd. CAPITAL STRUCTURE AUTHORISED ISSUED
DESIGNATED ADVISOR: AcaciaCap Advisors (Pty) Ltd. VOD Ords no par 4 000 000 000 2 077 841 204
AUDITORS: LDP Inc. DISTRIBUTIONS [ZARc]
CAPITAL STRUCTURE AUTHORISED ISSUED Ords no par Ldt Pay Amt
VIS Ords no par value 5 000 000 000 1 109 116 671 Interim No 31 26 Nov 24 2 Dec 24 285.00
Final No 30 18 Jun 24 24 Jun 24 285.00
LIQUIDITY: Apr25 Avg 1m shares p.w., R30 105.6(4.8% p.a.)
LIQUIDITY: Apr25 Avg 8m shares p.w., R803.6m(18.9% p.a.)
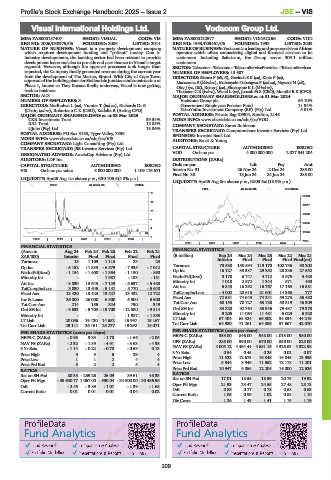
REDS 40 Week MA VISUAL
FTEL 40 Week MA VODACOM
17
21848
14
18917
11
15986
7
13055
4
10124
1
2020 | 2021 | 2022 | 2023 | 2024 | 7193
2020 | 2021 | 2022 | 2023 | 2024 |
FINANCIAL STATISTICS
(Amts in Aug 24 Feb 24 Feb 23 Feb 22 Feb 21 FINANCIAL STATISTICS
ZAR’000) Interim Final Final Final Final (R million) Sep 24 Mar 24 Mar 23 Mar 22 Mar 21
Turnover 13 1 109 1 115 23 23 Interim Final Final Final Final(rst)
Op Inc - 5 152 11 833 - 6 579 - 7 935 - 7 012 Turnover 73 538 150 594 119 170 102 736 98 302
NetIntPd(Rcvd) - 1 154 - 1 408 - 1 354 - 1 190 - 890 Op Inc 16 127 35 337 29 252 28 236 27 652
Minority Int - - 1 987 - 133 - 151 NetIntPd(Rcvd) 3 178 6 747 4 712 3 675 3 423
Att Inc - 3 830 13 645 - 7 129 - 5 637 - 5 488 Minority Int 1 018 2 972 1 344 571 490
TotCompIncLoss 3 830 13 645 - 5 141 - 5 770 - 5 640 Att Inc 6 843 16 292 16 767 17 163 16 581
Fixed Ass 13 420 13 423 13 427 13 432 12 722 TotCompIncLoss - 4 002 20 616 21 601 14 366 777
Inv & Loans 26 000 26 000 6 500 6 500 6 500 Fixed Ass 72 531 74 643 74 241 59 273 56 480
Tot Curr Ass 214 155 324 790 349 Tot Curr Ass 68 155 70 727 65 788 50 519 46 309
Ord SH Int - 9 533 - 5 703 - 19 708 - 12 580 - 9 814 Ord SH Int 83 220 92 764 85 946 79 437 79 370
Minority Int - - - - 1 987 - 1 853 Minority Int 9 205 11 064 11 481 6 029 6 320
LT Liab 20 056 19 120 14 682 15 997 15 167 LT Liab 67 404 65 524 66 502 34 834 44 219
Tot Curr Liab 64 980 71 261 64 386 57 667 42 070
Tot Curr Liab 29 111 26 161 25 277 19 292 16 071
PER SHARE STATISTICS (cents per share) PER SHARE STATISTICS (cents per share)
HEPS-C (ZARc) - 0.93 3.33 - 1.78 - 1.66 - 2.05 HEPS-C (ZARc) 353.00 846.00 948.00 1 013.00 980.00
NAV PS (ZARc) - 2.32 - 1.39 - 4.91 - 3.63 - 4.35 DPS (ZARc) 285.00 590.00 670.00 850.00 825.00
3 Yr Beta - 1.14 - 0.22 - 0.78 - 0.69 0.13 NAV PS (ZARc) 4 005.12 4 464.44 4 681.15 4 326.63 4 322.98
Price High 5 3 6 29 4 3 Yr Beta 0.54 0.45 0.25 0.02 0.07
Price Low 1 1 2 4 4 Price High 11 522 12 673 16 348 16 045 13 935
Price Prd End 3 2 2 5 4 Price Low 8 544 8 946 11 562 12 178 11 201
RATIOS Price Prd End 10 947 9 855 12 204 16 000 12 626
Ret on SH Fnd 80.35 - 239.26 26.09 39.61 48.33 RATIOS
Oper Pft Mgn - 39 630.77 1 067.00 - 590.04 - 34 500.00 - 30 486.96 Ret on SH Fnd 17.01 18.55 18.59 20.75 19.92
D:E - 2.45 - 3.89 - 1.07 - 1.39 - 1.68 Oper Pft Mgn 21.93 23.47 24.55 27.48 28.13
Current Ratio 0.01 0.01 0.01 0.04 0.02 D:E 0.88 0.77 0.78 0.68 0.63
Current Ratio 1.05 0.99 1.02 0.88 1.10
Div Cover 1.24 1.43 1.41 1.19 1.19
209