
Page 203 - Profile's Stock Exchange Handbook -2024 Issue 4
P. 203
Profile’s Stock Exchange Handbook: 2024 – Issue 4 JSE – TEL
Telkom SA SOC Ltd. Texton Property Fund Ltd.
TEL TEX
ISIN: ZAE000044897 SHORT: TELKOM CODE: TKG ISIN: ZAE000190542 SHORT: TEX CODE: TEX
REG NO: 1991/005476/30 FOUNDED: 1991 LISTED: 2003 REG NO: 2005/019302/06 FOUNDED: 2011 LISTED: 2011
NATURE OF BUSINESS: Telkom is a leading information and NATURE OF BUSINESS: Texton is a JSE-listed Real Estate Investment Trust
communications technology (ICT) services provider in South Africa. We (“REIT”) that offers shareholders direct access to its high-quality property
offer end-to-end ICT solutions, including high-speed fibre, mobile and portfolio.Texton’s portfolio is valued at R2.2 billion as at 30 June 2023 (2022:
data services, information technology (IT) services, property management R2.6billion)andaimstodeliverlong-termincomeandcapitalgrowth.Weare
and masts and towers solutions. focusedoninvestinginhigh-qualitypropertiesincentralisednodesinbothSA
SECTOR: Telecoms—Telecoms—TelecomServiceProvider—TelecomServices and the UK across office, industrial and retail properties.
NUMBER OF EMPLOYEES: 9 877 SECTOR: RealEstate—RealEstate—REITS—Office
DIRECTORS: Booi M (ind ne), Ighodaro O (ind ne, Nig), Kennedy B (ind ne), NUMBER OF EMPLOYEES: 24
Lebina K P (ind ne), Luthuli P C S (ind ne), Matenge-Sebesho E G (ind ne), DIRECTORS: FrancoRA(ne), HanningtonAJ(snr ind ne),
Msimang M (ind ne), Rayner K A (ind ne), Selele I (ind ne), Sibisi Dr S van der VentWC(ind ne), GoldingMJA (Chair, ne), Rens J (CEO),
WellemanHSP (CFO), Macey J (ld ind ne)
P(ind ne), Singh E (ind ne), Yoon S H (ne), Qhena M G (Chair, ind ne),
Taukobong S (Group CE), Dlamini N (Group CFO) MAJOR ORDINARY SHAREHOLDERS as at 30 Jun 2024
MAJOR ORDINARY SHAREHOLDERS as at 23 Aug 2024 Oak Tech Trading (Pty) Ltd. 29.45%
19.42%
Thibault REIT Ltd.
The Government of the Republic of South Africa 40.52% Kloof Capital South Africa (Pty) Ltd. 14.30%
Government Employees Pension Fund 15.89%
Public Investment Company SOC Ltd. 9.95% POSTAL ADDRESS: PO Box 653129, Benmore, 2010
POSTAL ADDRESS: Private Bag X881, Pretoria, 0001 MORE INFO: www.sharedata.co.za/sdo/jse/TEX
MORE INFO: www.sharedata.co.za/sdo/jse/TKG COMPANY SECRETARY: CorpStat Governance Services (Pty) Ltd.
COMPANY SECRETARY: Ephy Motlhamme TRANSFER SECRETARY: Computershare Investor Services (Pty) Ltd.
TRANSFER SECRETARY: Computershare Investor Services (Pty) Ltd. SPONSOR: Investec Bank Ltd.
SPONSOR: Nedbank CIB AUDITORS: BDO South Africa Inc.
AUDITORS: PwC Inc. CAPITAL STRUCTURE AUTHORISED ISSUED
TEX Ords of no par 2 000 000 000 330 059 664
CAPITAL STRUCTURE AUTHORISED ISSUED
TKG Ords of R10.00 ea 1 000 000 000 511 140 239 DISTRIBUTIONS [ZARc]
Ords of no par Ldt Pay Amt
DISTRIBUTIONS [ZARc]
Ords of R10.00 ea Ldt Pay Amt Final No 21 8 Oct 24 14 Oct 24 20.13
Final No 26 7 Jul 20 13 Jul 20 50.08 Final No 20 17 Oct 23 23 Oct 23 19.26
Interim No 25 26 Nov 19 2 Dec 19 71.53 LIQUIDITY: Oct24 Avg 100 405 shares p.w., R290 907.8(1.6% p.a.)
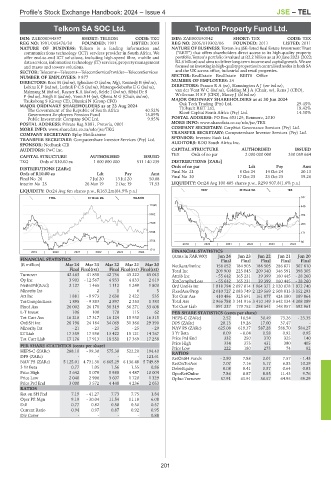
LIQUIDITY: Oct24 Avg 6m shares p.w., R163.2m(64.9% p.a.) REIV 40 Week MA TEX
FTEL 40 Week MA TELKOM 537
11925
446
9882 354
7839
263
5796 171
3754 80
2019 | 2020 | 2021 | 2022 | 2023 | 2024
1711 FINANCIAL STATISTICS
2019 | 2020 | 2021 | 2022 | 2023 | 2024
(Amts in ZAR’000) Jun 24 Jun 23 Jun 22 Jun 21 Jun 20
FINANCIAL STATISTICS
Final Final Final Final Final
(R million) Mar 24 Mar 23 Mar 22 Mar 21 Mar 20 NetRent/InvInc 158 052 184 905 188 505 286 871 307 810
Final Final(rst) Final Final(rst) Final(rst) Total Inc 209 900 225 045 209 340 346 591 398 305
Turnover 42 463 41 838 42 756 43 222 43 043 Attrib Inc - 55 642 165 231 39 399 160 445 - 28 260
Op Inc 3 903 - 12 567 4 933 4 833 2 619 TotCompIncLoss - 55 642 165 231 39 399 160 445 - 28 260
NetIntPd(Rcvd) 2 127 1 465 1 112 1 249 1 803 Ord UntHs Int 1 918 794 2 097 014 1 964 371 2 120 078 1 972 740
Minority Int - 2 1 6 5 FixedAss/Prop 2 010 727 2 083 749 2 129 569 2 508 813 3 152 293
Att Inc 1 881 - 9 973 2 630 2 422 535 Tot Curr Ass 410 486 325 691 161 077 424 180 189 864
TotCompIncLoss 1 895 - 9 883 2 897 2 353 1 383 Total Ass 2 966 788 3 141 916 3 410 149 3 642 134 4 208 089
Fixed Ass 26 002 26 178 38 319 36 271 33 608 Tot Curr Liab 891 227 179 752 298 541 148 957 592 961
L-T Invest 106 108 170 115 62 PER SHARE STATISTICS (cents per share)
Tot Curr Ass 16 216 17 317 16 124 15 930 16 315 HEPS-C (ZARc) 2.52 16.54 30.49 73.26 - 23.35
Ord SH Int 26 196 24 184 34 069 31 366 29 390 DPS (ZARc) 20.13 19.26 17.00 37.47 -
Minority Int - 21 - 23 - 25 - 25 - 29 NAV PS (ZARc) 625.08 619.37 587.28 588.70 584.27
LT Liab 17 359 17 550 13 422 15 121 14 767 3 Yr Beta 0.09 - 0.04 0.58 0.92 0.95
Tot Curr Liab 17 176 17 913 18 551 17 369 17 258 Price Prd End 332 250 370 325 140
Price High 334 375 431 380 405
PER SHARE STATISTICS (cents per share) Price Low 222 180 275 74 82
HEPS-C (ZARc) 288.10 - 99.30 575.30 522.20 194.40 RATIOS
DPS (ZARc) - - - - 121.61 RetOnSH Funds - 2.90 7.88 2.01 7.57 - 1.43
NAV PS (ZARc) 5 125.01 4 731.38 6 665.29 6 136.48 5 749.89 RetOnTotAss 7.07 7.16 5.17 6.83 10.29
3 Yr Beta 0.77 1.05 1.56 1.55 0.86 Debt:Equity 0.08 0.41 0.57 0.64 0.83
Price High 3 642 5 070 5 980 4 487 10 004 OperRetOnInv 7.86 8.87 8.85 11.43 9.76
Price Low 2 040 2 908 3 607 1 720 1 329 OpInc:Turnover 57.91 61.91 56.57 64.95 59.29
Price Prd End 3 000 3 572 4 448 4 236 2 053
RATIOS
Ret on SH Fnd 7.19 - 41.27 7.73 7.75 1.84
Oper Pft Mgn 9.19 - 30.04 11.54 11.18 6.08
D:E 0.77 0.82 0.50 0.50 0.57
Current Ratio 0.94 0.97 0.87 0.92 0.95
Div Cover - - - - 0.88
201