
Page 204 - Profile's Stock Exchange Handbook -2024 Issue 4
P. 204
JSE – THA Profile’s Stock Exchange Handbook: 2024 – Issue 4
Tharisa plc Thungela Resources Ltd.
THA THU
ISIN: CY0103562118 SHORT: THARISA CODE: THA ISIN: ZAE000296554 SHORT: THUNGELA CODE: TGA
REG NO: HE223412 FOUNDED: 2006 LISTED: 2014 REG NO: 2021/303811/06 FOUNDED: 2020 LISTED: 2021
NATURE OF BUSINESS: The principal activity of the Company is that of an NATURE OF BUSINESS: Thungela, a Zulu word which means ”to ignite”,
investment holding company with controlling interests in platinum group is a leading South African thermal coal business. It is one of the largest
metals (‘PGM’) and chrome mining & processing and associated sales and pure-play producers and exporters of thermal coal in South Africa based on
logistics operations. The principal activity remains unchanged from the aggregate coal reserves and marketable coal production. The Group owns
previous year. Its major investment is its wholly-owned subsidiary, Tharisa interests in, and produces its thermal coal predominantly from seven
Minerals (Pty) Ltd. (‘Tharisa Minerals’). Tharisa Minerals owns and operates mining operations, namely Goedehoop, Greenside, Isibonelo, Khwezela,
the Tharisa Mine, an open pit PGM and chrome mine located in the Bushveld AAIC (operating the Zibulo Colliery), Mafube Coal Mining (operating the
ComplexofSouthAfrica.Inaddition,theCompanyhasa75%shareholdingin Mafube Colliery) and Butsanani Energy (owning the independently
Karo Mining Holdings plc which has an indirect 85% interest in a operated Rietvlei Colliery) which consist of both underground and
development stage PGM asset, located on the Great Dyke in Zimbabwe. opencast mines located in the Mpumalanga province of South Africa.
SECTOR:BasicMaterials—BasicResrcs—IndMet&Min—GeneralMining Thungela’s operations are among the highest quality thermal coal mines in
NUMBER OF EMPLOYEES: 3 779 South Africa by calorific value.
DIRECTORS: Bell C (ld ind ne), Chen H (ne), Davey R (ind ne, UK), SECTOR: Energy—Energy—OilGas&Coal—Coal
KamalOM(ind ne), LoSWM(ne, China), Salter DrJD(ld ind ne, UK), NUMBER OF EMPLOYEES: 4 592
Zvaravanhu G (ind ne), Pouroulis L C (Chair), Pouroulis P (CEO), DIRECTORS: FrenchSG(ind ne), Jekwa DrNY(ind ne), Kodisang B
Jones M G (CFO) M(ind ne), McKeithTD(ind ne), Mzondeki K (ind ne), Ntsaluba S
MAJOR ORDINARY SHAREHOLDERS as at 30 Sep 2023 S (Chair, ind ne), Ndlovu J (CEO), Smith D (CFO)
Medway Developments Ltd. 41.10% MAJOR ORDINARY SHAREHOLDERS as at 25 Oct 2024
Rance Holdings Ltd. 12.84% Public Investment Corporation (SOC) Ltd. 18.52%
POSTAL ADDRESS: PO Box 62425, Paphos, Cyprus, 8064 Anglo American 7.96%
MORE INFO: www.sharedata.co.za/sdo/jse/THA Allan Gray (Pty) Ltd. 5.01%
COMPANY SECRETARY: Lysandros Lysandrides, Sanet Findlay POSTAL ADDRESS: PO Box 1521, Saxonwold, 2132
TRANSFER SECRETARY: Computershare Investor Services (Pty) Ltd. MORE INFO: www.sharedata.co.za/sdo/jse/TGA
SPONSOR: Investec Bank Ltd. COMPANY SECRETARY: Francois Klem
AUDITORS: BDO Cyprus TRANSFER SECRETARY: Computershare Investor Services (Pty) Ltd.
SPONSOR:RandMerchantBank(AdivisionofFirstRandBankLtd.(SA))
CAPITAL STRUCTURE AUTHORISED ISSUED AUDITORS: PwC Inc.
THA Ords USD0.001 10 000 000 000 302 596 743
CAPITAL STRUCTURE AUTHORISED ISSUED
DISTRIBUTIONS [USDc] TGA Ords no par value 10 000 000 000 140 492 585
Ords USD0.001 Ldt Pay Amt
Interim No 14 11 Jun 24 26 Jun 24 1.50 DISTRIBUTIONS [ZARc]
Final No 13 27 Feb 24 13 Mar 24 2.00 Ords no par value Ldt Pay Amt
Interim No 6 17 Sep 24 23 Sep 24 200.00
LIQUIDITY: Oct24 Avg 248 230 shares p.w., R4.1m(4.3% p.a.)
Final No 5 16 Apr 24 22 Apr 24 1000.00
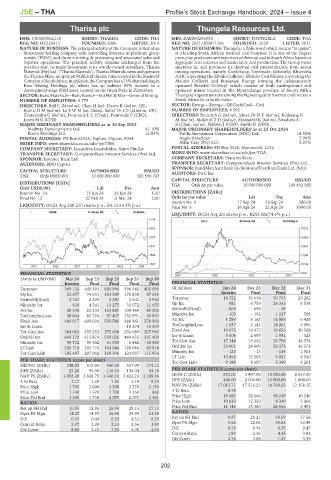
INDM 40 Week MA THARISA
LIQUIDITY: Oct24 Avg 2m shares p.w., R253.5m(74.6% p.a.)
5198
OILP 40 Week MA THUNGELA
4365 37752
3533 30849
2701 23947
1869 17044
1037 10142
2019 | 2020 | 2021 | 2022 | 2023 | 2024
FINANCIAL STATISTICS 2021 | 2022 | 2023 | 2024 3239
(Amts in USD’000) Mar 24 Sep 23 Sep 22 Sep 21 Sep 20
Interim Final Final Final Final FINANCIAL STATISTICS
Turnover 369 132 649 893 685 996 596 345 405 995 (R million) Jun 24 Dec 23 Dec 22 Dec 21
Interim Final Final Final
Op Inc 52 677 94 691 184 549 178 838 87 645
NetIntPd(Rcvd) 2 747 2 329 3 382 3 502 5 982 Turnover 16 752 30 634 50 753 26 282
Minority Int 430 4 541 13 275 31 072 11 655 Op Inc 981 6 759 28 333 8 538
Att Inc 38 378 82 235 153 881 100 469 43 296 NetIntPd(Rcvd) - 805 - 696 - 49 -
TotCompIncLoss 38 044 86 776 97 407 151 991 30 833 Minority Int - 103 - 192 1 217 509
Fixed Ass 689 917 609 694 569 580 380 461 278 960 Att Inc 1 289 5 162 16 988 6 429
Inv & Loans - - - 10 274 10 303 TotCompIncLoss 1 037 5 141 18 261 6 896
Tot Curr Ass 384 002 455 252 375 608 292 689 207 980 Fixed Ass 19 675 19 477 10 656 10 568
Ord SH Int 649 170 615 874 559 026 444 432 351 409 Inv & Loans 3 606 2 499 1 981 323
Minority Int 59 732 59 302 61 355 6 842 - 30 580 Tot Curr Ass 17 344 19 642 23 798 16 374
LT Liab 200 718 205 776 164 544 128 086 69 918 Ord SH Int 23 903 24 609 26 273 16 573
Tot Curr Liab 185 487 207 092 168 396 124 037 115 854 Minority Int - 123 - 13 - 114 1 901
LT Liab 13 056 13 203 9 067 8 550
PER SHARE STATISTICS (cents per share) Tot Curr Liab 9 188 8 687 5 349 4 261
HEPS-C (ZARc) 248.03 515.06 650.20 567.99 274.12
DPS (ZARc) 27.28 95.58 116.33 136.04 53.18 PER SHARE STATISTICS (cents per share)
NAV PS (ZARc) 3 992.40 3 848.75 3 340.10 2 432.23 2 185.86 HEPS-C (ZARc) 952.00 3 497.00 13 082.00 6 657.00
3 Yr Beta 1.17 1.20 1.51 1.19 0.74 DPS (ZARc) 200.00 2 000.00 10 000.00 1 800.00
Price High 1 730 2 600 3 500 3 270 2 150 NAV PS (ZARc) 17 013.71 17 516.23 18 700.63 12 158.15
Price Low 1 140 1 670 1 700 1 350 860 3 Yr Beta - 0.78 - - -
Price Prd End 1 350 1 730 2 075 2 070 1 481 Price High 15 682 28 666 38 249 10 246
RATIOS Price Low 10 020 12 350 8 340 2 066
Ret on SH Fnd 10.95 12.85 26.94 29.15 17.13 Price Prd End 11 146 15 380 28 666 8 454
Oper Pft Mgn 14.27 14.57 26.90 29.99 21.59 RATIOS
D:E 0.35 0.40 0.33 0.32 0.39 Ret on SH Fnd 9.97 20.21 69.59 37.56
Current Ratio 2.07 2.20 2.23 2.36 1.80 Oper Pft Mgn 5.86 22.06 55.83 32.49
Div Cover 8.82 5.22 7.32 4.08 4.94 D:E 0.55 0.54 0.35 0.47
Current Ratio 1.89 2.26 4.45 3.84
Div Cover 4.76 1.88 1.27 3.39
202