
Page 207 - Profile's Stock Exchange Handbook -2024 Issue 4
P. 207
Profile’s Stock Exchange Handbook: 2024 – Issue 4 JSE – TRE
Trematon Capital Investments Ltd. Trencor Ltd.
TRE TRE
ISIN: ZAE000013991 SHORT: TREMATON CODE: TMT ISIN: ZAE000007506 SHORT: TRENCOR CODE: TRE
REG NO: 1997/008691/06 FOUNDED: 1997 LISTED: 1997 REG NO: 1955/002869/06 FOUNDED: 1955 LISTED: 1955
NATURE OF BUSINESS:Trematonis aninvestmentholding company that NATURE OF BUSINESS: Trencor Ltd. is a cash company listed on the JSE.
invests in assets and businesses which management believes are It intends to distribute its cash resources to shareholders as and when
undervalued or where management can create value that has the potential these become commercially available.
to achieve their targeted internal rate of return. SECTOR: Inds—IndsGoods & Services—IndsTransport—TransportSer
SECTOR: Fins—FinServcs—ClosedEndInvstmnts—ClosedEndInvstmnts NUMBER OF EMPLOYEES: 3
NUMBER OF EMPLOYEES: 512 DIRECTORS: Nurek D M (Chair, ind ne), Oblowitz E (ind ne),
DIRECTORS: Fisher J P (ind ne), Getz K (ne), Groll A, Sessions M (ind ne), Sieni R A (CEO & FD), SparksRJA(ld ind ne)
Stumpf R (ne), Lockhart-Ross R (Chair, ind ne), Shapiro A J (CEO), MAJOR ORDINARY SHAREHOLDERS as at 28 Oct 2024
Winkler A L (CFO) African Phoenix Investments Ltd. 19.11%
MAJOR ORDINARY SHAREHOLDERS as at 23 Aug 2023 Peresec Prime Brokers (Pty) Ltd. 10.70%
The Suikerbos Trust 29.27% CoroCapital (Pty) Ltd. 7.57%
The Armchair Trust 24.60% POSTAL ADDRESS: Suite 304, Sea Point Medical Centre, 11 Kloof Road,
Buff-Shares (Pty) Ltd. 8.23% Sea Point, 8005
POSTAL ADDRESS: PO Box 15176, Vlaeberg, 8018 MORE INFO: www.sharedata.co.za/sdo/jse/TRE
MORE INFO: www.sharedata.co.za/sdo/jse/TMT COMPANY SECRETARY: Trencor Services (Pty) Ltd.
COMPANY SECRETARY: Jac Vos TRANSFER SECRETARY: Computershare Investor Services (Pty) Ltd.
TRANSFER SECRETARY: JSE Investor Services (Pty) Ltd. SPONSOR: Investec Bank Ltd.
SPONSOR: Questco Corporate Advisory (Pty) Ltd. AUDITORS: KPMG Inc.
AUDITORS: Moore Cape Town Inc.
CAPITAL STRUCTURE AUTHORISED ISSUED
CAPITAL STRUCTURE AUTHORISED ISSUED TRE Ords 0.5c ea 200 000 000 173 534 676
TMT Ords 1c ea 1 000 000 000 222 774 248
DISTRIBUTIONS [ZARc]
DISTRIBUTIONS [ZARc] Ords 0.5c ea Ldt Pay Amt
Ords 1c ea Ldt Pay Amt Special No 107 27 Oct 20 2 Nov 20 160.00
Share Premium No 15 11 Dec 23 18 Dec 23 32.00 Final No 106 21 Apr 20 28 Apr 20 185.00
Share Premium No 14 12 Dec 22 19 Dec 22 40.00
LIQUIDITY: Oct24 Avg 708 402 shares p.w., R5.9m(21.2% p.a.)
LIQUIDITY: Oct24 Avg 151 515 shares p.w., R333 432.1(3.5% p.a.)
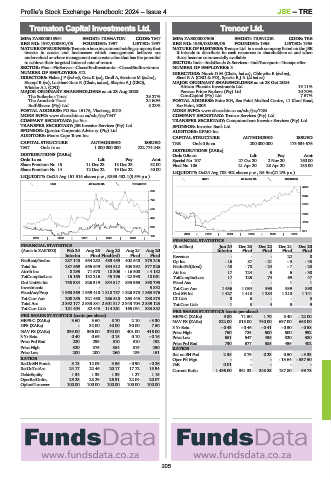
INDT 40 Week MA TRENCOR
EQII 40 Week MA TREMATON
4466
865
3647
725
2828
585
2009
445
1190
305
371
2019 | 2020 | 2021 | 2022 | 2023 | 2024
165
2019 | 2020 | 2021 | 2022 | 2023 |
FINANCIAL STATISTICS
FINANCIAL STATISTICS (R million) Jun 24 Dec 23 Dec 22 Dec 21 Dec 20
(Amts in ZAR’000) Feb 24 Aug 23 Aug 22 Aug 21 Aug 20 Interim Final Final Final Final
Interim Final Final(rst) Final Final Revenue - - - 22 8
NetRent/InvInc 287 148 554 252 489 459 402 540 375 246 Op Inc - 16 87 - 21 - 3 - 43
Total Inc 287 669 555 649 494 512 403 392 377 326 NetIntPd(Rcvd) - 43 -78 - 24 -7 -23
Attrib Inc 8 295 71 578 18 306 - 16 500 - 4 182 Att Inc 17 124 3 6 - 38
TotCompIncLoss 15 165 132 216 45 196 - 22 998 18 061 TotCompIncLoss 17 125 74 69 47
Ord UntHs Int 758 384 826 319 834 517 835 965 898 795 Fixed Ass - - - 1 1
Investments - - - - 5 832 Tot Curr Ass 1 436 1 084 993 939 898
FixedAss/Prop 1 963 369 1 959 410 1 818 757 1 826 373 1 863 976 Ord SH Int 1 427 1 410 1 284 1 210 1 141
Tot Curr Ass 208 255 321 488 266 518 263 443 230 573 LT Liab 8 6 - - 3
Total Ass 2 392 177 2 533 831 2 501 317 2 343 704 2 389 123 Tot Curr Liab 1 3 4 5 9
Tot Curr Liab 181 404 82 443 114 261 165 031 333 882
PER SHARE STATISTICS (cents per share)
PER SHARE STATISTICS (cents per share) HEPS-C (ZARc) 9.80 71.50 1.70 3.40 - 22.00
HEPS-C (ZARc) 3.60 3.60 8.70 2.10 - 3.30 NAV PS (ZARc) 822.00 813.00 740.00 697.00 658.00
DPS (ZARc) - 32.00 40.00 30.00 7.50 3 Yr Beta - 0.43 - 0.46 - 0.41 - 0.50 - 0.58
NAV PS (ZARc) 339.00 366.00 370.00 401.00 416.00 Price High 750 725 600 500 992
3 Yr Beta 0.40 0.69 0.15 0.10 - 0.16 Price Low 651 547 436 320 380
Price Prd End 220 299 310 310 192 Price Prd End 730 677 585 459 402
Price High 320 375 384 319 290 RATIOS
Price Low 200 200 260 189 151 Ret on SH Fnd 2.38 8.79 0.23 0.50 - 3.33
RATIOS Oper Pft Mgn - - - - 13.64 - 537.50
RetOnSH Funds 3.13 12.09 3.56 - 0.90 - 0.26 D:E 0.01 - - - -
RetOnTotAss 24.17 22.46 20.17 17.72 15.94 Current Ratio 1 436.00 361.33 248.25 187.80 99.78
Debt:Equity 1.34 1.33 1.39 1.27 1.15
OperRetOnInv 29.25 28.29 26.91 22.04 20.07
OpInc:Turnover 100.00 100.00 100.00 100.00 100.00
205