
Page 210 - Profile's Stock Exchange Handbook -2024 Issue 4
P. 210
JSE – VIS Profile’s Stock Exchange Handbook: 2024 – Issue 4
Visual International Holdings Ltd. Vodacom Group Ltd.
VIS VOD
ISIN: ZAE000187407 SHORT: VISUAL CODE: VIS ISIN: ZAE000132577 SHORT: VODACOM CODE: VOD
REG NO: 2006/030975/06 FOUNDED: 2006 LISTED: 2014 REG NO: 1993/005461/06 FOUNDED: 1993 LISTED: 2009
NATURE OF BUSINESS: Visual is a property development company, NATURE OF BUSINESS: Vodacom is a leading and purpose-driven African
which requires development funding and “patient” money. Due to operator which offers connectivity, digital and financial services to its
industry developments, the banking sector had been reticent to provide customers.IncludingSafaricom,theGroupserves203.1millioncustomers.
development loans and also to provide end user finance to Visual’s target Overarich30-yearhistoryinthetelecommunicationsindustry,Vodacomhas
segment. However, although the approval processes took longer than expanded its business from South Africa to include controlled operations in
expected, the Company finally generated revenue during the current year DRC,Egypt,Lesotho,MozambiqueandTanzaniaandhaveexposuretoKenya
from the development of The Marine, Strand. With City of Cape Town and Ethiopia through its associate holding in Safaricom. Vodacom is evolving
approval of the building plans for Stellendale Junction and construction of from being a TelCo to Africa’s leading TechCo, pioneering innovative
Phase 1, known as They Knysna finally underway, Visual is now getting solutions to shape the future of connectivity and technology.
back to business. SECTOR:Telecoms—Telecoms—TelecomServiceProvider—TelecomServices
The securing of development funding for its other property developments NUMBER OF EMPLOYEES: 13 687
will be a key initiative in the 2024/2025 years. DIRECTORS: Bianco F (alt, It), Govinda S K (ne), Klotz P (ne),
SECTOR: AltX Macozoma S (ld ind ne), Mahanyele-Dabengwa P (ind ne), Nqweni N (alt),
NUMBER OF EMPLOYEES: 3 Otty J (ne, UK), Reiter J (ne), Shuenyane K L (ld ind ne),
DIRECTORS: Matlholwa L (ne), Vorster T (ind ne), Thomson C B (ind ne), WoodL(ne), Joosub M S (CEO), Morathi R K (CFO)
Richards Dr R (Chair, ind ne), Robertson C K (CEO), MAJOR ORDINARY SHAREHOLDERS as at 31 Mar 2024
Kadalie R (Acting CFO) Vodafone Group plc 65.10%
MAJOR ORDINARY SHAREHOLDERS as at 29 Feb 2024 Government Employees Pension Fund 11.94%
CKR Investment Trust 19.79% YeboYethu Investment Company (RF) (Pty) Ltd. 5.51%
RAL Trust 18.85% POSTAL ADDRESS: Private Bag X9904, Sandton, 2146
POSTAL ADDRESS: PO Box 3163, Tyger Valley, 7536 MORE INFO: www.sharedata.co.za/sdo/jse/VOD
MORE INFO: www.sharedata.co.za/sdo/jse/VIS COMPANY SECRETARY: Karen Robinson
COMPANY SECRETARY: Light Consulting (Pty) Ltd. TRANSFER SECRETARY: Computershare Investor Services (Pty) Ltd.
TRANSFER SECRETARY: JSE Investor Services (Pty) Ltd. SPONSORS: Nedbank Corporate and Investment Banking, a division of
DESIGNATED ADVISOR: AcaciaCap Advisors (Pty) Ltd. Nedbank Ltd.
AUDITORS: LDP Inc. AUDITORS: Ernst & Young
CAPITAL STRUCTURE AUTHORISED ISSUED CAPITAL STRUCTURE AUTHORISED ISSUED
VIS Ords no par value 1 000 000 000 410 265 547 VOD Ords no par 4 000 000 000 2 077 841 204
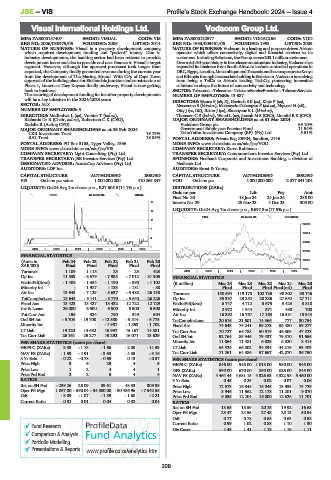
LIQUIDITY: Oct24 Avg 1m shares p.w., R27 605.5(14.1% p.a.) DISTRIBUTIONS [ZARc]
Ords no par Ldt Pay Amt
REDS 40 Week MA VISUAL
Final No 30 18 Jun 24 24 Jun 24 285.00
17 Interim No 29 28 Nov 23 4 Dec 23 305.00
14 LIQUIDITY: Oct24 Avg 7m shares p.w., R697.3m(17.5% p.a.)
FTEL 40 Week MA VODACOM
11
22999
7
19914
4
16828
1
2019 | 2020 | 2021 | 2022 | 2023 | 2024
13743
FINANCIAL STATISTICS
10657
(Amts in Feb 24 Feb 23 Feb 22 Feb 21 Feb 20
ZAR’000) Final Final Final Final Final
7572
Turnover 1 109 1 115 23 23 423 2019 | 2020 | 2021 | 2022 | 2023 | 2024
Op Inc 11 833 - 6 579 - 7 935 - 7 012 - 31 905 FINANCIAL STATISTICS
NetIntPd(Rcvd) - 1 408 - 1 354 - 1 190 - 890 - 1 102 (R million) Mar 24 Mar 23 Mar 22 Mar 21 Mar 20
Minority Int - 1 987 - 133 - 151 - 88 Final Final Final Final(rst) Final
Att Inc 13 645 - 7 129 - 5 637 - 5 488 - 26 138 Turnover 150 594 119 170 102 736 98 302 90 746
TotCompIncLoss 13 645 - 5 141 - 5 770 - 5 640 - 26 226 Op Inc 35 337 29 252 28 236 27 652 27 711
Fixed Ass 13 423 13 427 13 432 12 722 12 729 NetIntPd(Rcvd) 6 747 4 712 3 675 3 423 3 818
Inv & Loans 26 000 6 500 6 500 6 500 6 500 Minority Int 2 972 1 344 571 490 700
Tot Curr Ass 155 324 790 349 504 Att Inc 16 292 16 767 17 163 16 581 15 944
Ord SH Int - 5 703 - 19 708 - 12 580 - 9 814 - 6 775 TotCompIncLoss 20 616 21 601 14 366 777 30 754
Minority Int - - - 1 987 - 1 853 - 1 702 Fixed Ass 74 643 74 241 59 273 56 480 59 277
LT Liab 19 120 14 682 15 997 15 167 14 581 Tot Curr Ass 70 727 65 788 50 519 46 309 47 828
Tot Curr Liab 26 161 25 277 19 292 16 071 13 629 Ord SH Int 92 764 85 946 79 437 79 370 91 656
PER SHARE STATISTICS (cents per share) Minority Int 11 064 11 481 6 029 6 320 8 414
HEPS-C (ZARc) 3.33 - 1.78 - 1.66 - 2.05 - 11.53 LT Liab 65 524 66 502 34 834 44 219 53 403
NAV PS (ZARc) - 1.39 - 4.91 - 3.63 - 4.35 - 3.16 Tot Curr Liab 71 261 64 386 57 667 42 070 36 750
3 Yr Beta - 0.22 - 0.78 - 0.69 0.13 - 0.57 PER SHARE STATISTICS (cents per share)
Price High 3 6 29 4 5 HEPS-C (ZARc) 846.00 948.00 1 013.00 980.00 945.00
Price Low 1 2 4 4 1 DPS (ZARc) 590.00 670.00 850.00 825.00 845.00
Price Prd End 2 2 5 4 4 NAV PS (ZARc) 4 464.44 4 681.15 4 326.63 4 322.98 5 450.00
RATIOS 3 Yr Beta 0.45 0.25 0.02 0.07 0.06
Ret on SH Fnd - 239.26 26.09 39.61 48.33 309.38 Price High 12 673 16 348 16 045 13 935 13 729
Oper Pft Mgn 1 067.00 - 590.04 - 34 500.00 - 30 486.96 - 7 542.55 Price Low 8 946 11 562 12 178 11 201 9 070
D:E - 3.89 - 1.07 - 1.39 - 1.68 - 2.21 Price Prd End 9 855 12 204 16 000 12 626 11 701
Current Ratio 0.01 0.01 0.04 0.02 0.04 RATIOS
Ret on SH Fnd 18.55 18.59 20.75 19.92 16.63
Oper Pft Mgn 23.47 24.55 27.48 28.13 30.54
D:E 0.77 0.78 0.68 0.63 0.58
Current Ratio 0.99 1.02 0.88 1.10 1.30
Fund Research Div Cover 1.43 1.41 1.19 1.19 1.11
Comparison & Analysis
Portfolio Modelling
Presentations & Reports www.profile.co.za/analytics.htm
208