
Page 198 - Profile's Stock Exchange Handbook -2024 Issue 4
P. 198
JSE – SPE Profile’s Stock Exchange Handbook: 2024 – Issue 4
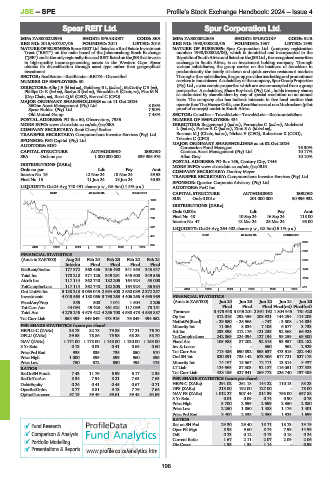
Spear REIT Ltd. Spur Corporation Ltd.
SPE SPU
ISIN: ZAE000228995 SHORT: SPEARREIT CODE: SEA ISIN: ZAE000022653 SHORT: SPURCORP CODE: SUR
REG NO: 2015/407237/06 FOUNDED: 2011 LISTED: 2016 REG NO: 1998/000828/06 FOUNDED: 1967 LISTED: 1999
NATURE OF BUSINESS: Spear REIT Ltd. listed as a Real Estate Investment NATURE OF BUSINESS: Spur Corporation Ltd. (company registration
Trust (“REIT”) on the main board of the Johannesburg Stock Exchange number: 1998/000828/06), which is domiciled and incorporated in the
(“JSE”) and is the only regionally-focused REIT listed on the JSE that invests Republic of South Africa and listed on the JSE Ltd., the recognised securities
in high-quality income-generating assets in the Western Cape. Spear exchange in South Africa, is an investment holding company. Through
obtains its diversification through asset type rather than geographical various subsidiaries, the group carries on the business of franchisor in
investment. predominantly the family sit-down and quick service restaurant markets.
SECTOR: RealEstate—RealEstate—REITS—Diversified Through other subsidiaries, the group provides marketing and promotional
NUMBER OF EMPLOYEES: 30 services to franchisees. A subsidiary of the company, Spur Group Properties
DIRECTORS: Allie J E (ld ind ne), Goldberg B L (ind ne), McCarthy C S (ne), (Pty) Ltd., owns certain properties which are owner-occupied from a group
Phillips Dr R (ind ne), Raziya B (ind ne), Varachhia A (Chair, ne), Flax M N perspective. A subsidiary, Share Buy-back (Pty) Ltd., holds treasury shares
(Dep Chair, ne), Rossi Q M (CEO), Barnard C (CFO) as authorised by shareholders by way of special resolution on an annual
MAJOR ORDINARY SHAREHOLDERS as at 11 Oct 2024 basis. The company also has indirect interests in five local entities that
36One Asset Management (Pty) Ltd. 8.08% operate four The Hussar Grills, one RocoMamas and one Modrockers (pilot
Spear Holdco (Pty) Ltd. 7.90% proof of concept) outlet in South Africa.
Old Mutual Group 7.48% SECTOR: ConsDisr—Travel&Leis—Travel&Leis—Resturants&Bars
POSTAL ADDRESS: PO Box 50, Observatory, 7935 NUMBER OF EMPLOYEES: 434
MORE INFO: www.sharedata.co.za/sdo/jse/SEA DIRECTORS: Boggenpoel J (ind ne), Fernandez C (ind ne), Molebatsi
COMPANY SECRETARY: René Cheryl Stober L(ind ne), ParkerAC(ind ne), ZinnSA(ld ind ne),
TRANSFER SECRETARY: Computershare Investor Services (Pty) Ltd. Bosman M J (Chair, ind ne), Nichas V (CEO), Robertson K (COO),
SPONSOR: PSG Capital (Pty) Ltd. Teixeira C (CFO)
AUDITORS: BDO MAJOR ORDINARY SHAREHOLDERS as at 02 Oct 2024
Coronation Fund Managers 16.30%
CAPITAL STRUCTURE AUTHORISED ISSUED Camissa Asset Management (Pty) Ltd. 10.17%
SEA Ords no par 1 000 000 000 339 986 976 Allan Gray 10.10%
POSTAL ADDRESS: PO Box 166, Century City, 7446
DISTRIBUTIONS [ZARc]
Ords no par Ldt Pay Amt MORE INFO: www.sharedata.co.za/sdo/jse/SUR
Interim No 16 12 Nov 24 18 Nov 24 39.53 COMPANY SECRETARY: Donfrey Meyer
TRANSFER SECRETARY: Computershare Investor Services (Pty) Ltd.
Final No 15 11 Jun 24 18 Jun 24 40.53
SPONSOR: Questco Corporate Advisory (Pty) Ltd.
LIQUIDITY: Oct24 Avg 740 491 shares p.w., R6.5m(11.3% p.a.) AUDITORS: PwC Inc.
REIV 40 Week MA SPEARREIT CAPITAL STRUCTURE AUTHORISED ISSUED
SUR Ords 0.001c 201 000 000 90 996 932
1035
DISTRIBUTIONS [ZARc]
899
Ords 0.001c Ldt Pay Amt
Final No 48 10 Sep 24 16 Sep 24 118.00
763
Interim No 47 18 Mar 24 25 Mar 24 95.00
627 LIQUIDITY: Oct24 Avg 264 402 shares p.w., R8.3m(15.1% p.a.)
491 TRAV 40 Week MA SPURCORP
3597
355
2019 | 2020 | 2021 | 2022 | 2023 | 2024
2981
FINANCIAL STATISTICS
(Amts in ZAR’000) Aug 24 Feb 24 Feb 23 Feb 22 Feb 21 2365
Interim Final Final Final Final
NetRent/InvInc 177 372 368 486 346 490 341 953 343 647 1749
Total Inc 178 218 371 126 349 291 345 600 349 556
1132
Attrib Inc 117 114 362 740 182 205 164 924 53 008
TotCompIncLoss 117 114 362 740 182 205 164 924 56 984 516
2019 | 2020 | 2021 | 2022 | 2023 | 2024
Ord UntHs Int 3 138 213 3 063 045 2 594 408 2 650 089 2 372 257
Investments 4 043 563 4 180 066 3 793 263 4 406 265 4 495 969 FINANCIAL STATISTICS
FixedAss/Prop 355 500 1 041 1 604 2 206 (Amts in ZAR’000) Jun 24 Jun 23 Jun 22 Jun 21 Jun 20
Tot Curr Ass 44 094 49 423 461 621 117 089 75 151 Final Final Final Final(rst) Final(rst)
Total Ass 4 275 245 4 673 422 4 256 708 4 530 473 4 583 887 Turnover 3 473 648 3 045 201 2 391 192 1 804 945 761 620
Tot Curr Liab 368 493 349 649 473 915 76 849 494 362 Op Inc 312 016 292 459 208 921 144 294 114 203
NetIntPd(Rcvd) - 29 580 - 25 965 - 747 - 3 508 - 14 034
PER SHARE STATISTICS (cents per share) Minority Int 11 064 8 834 7 105 6 677 3 733
HEPLU-C (ZARc) 38.73 82.78 79.85 77.21 76.70 Att Inc 233 598 212 176 121 235 92 568 66 924
DPLU (ZARc) 39.53 78.86 75.98 68.25 58.70 TotCompIncLoss 242 869 224 094 127 194 99 259 69 300
NAV (ZARc) 1 174.00 1 178.00 1 148.00 1 130.00 1 153.00 Fixed Ass 105 988 87 202 92 516 93 957 102 182
3 Yr Beta 0.13 0.03 0.41 0.65 0.60 Inv & Loans - - 350 962 2 929
Price Prd End 935 835 735 850 510 Tot Curr Ass 713 486 690 892 558 637 473 515 282 440
Price High 1 000 899 899 960 895 Ord SH Int 820 891 738 142 673 306 617 721 527 178
Price Low 750 672 690 495 475 Minority Int 14 167 13 567 12 711 13 314 8 437
RATIOS LT Liab 124 663 87 303 92 187 116 051 127 883
RetOnSH Funds 7.43 11.79 6.99 6.17 2.38 Tot Curr Liab 428 185 327 941 269 772 226 740 137 408
RetOnTotAss 8.34 7.94 8.21 7.63 7.63 PER SHARE STATISTICS (cents per share)
Debt:Equity 0.24 0.41 0.45 0.67 0.71 HEPS-C (ZARc) 291.02 261.18 144.22 110.13 83.23
OperRetOnInv 8.77 8.81 9.13 7.76 7.64 DPS (ZARc) 213.00 192.00 127.00 - 78.00
OpInc:Turnover 57.19 59.49 59.61 59.48 64.69 NAV PS (ZARc) 1 012.27 907.44 814.39 756.00 637.88
3 Yr Beta 0.01 0.09 0.74 0.90 0.75
Price High 3 700 2 599 2 699 2 350 2 880
Price Low 2 250 1 850 1 488 1 176 1 401
Price Prd End 3 400 2 335 2 055 1 925 1 699
RATIOS
Ret on SH Fnd 29.30 29.40 18.71 15.73 13.19
Fund Research
Oper Pft Mgn 8.98 9.60 8.74 7.99 14.99
Comparison & Analysis D:E 0.23 0.12 0.13 0.18 0.24
Current Ratio 1.67 2.11 2.07 2.09 2.06
Portfolio Modelling Div Cover 1.35 1.35 1.14 - 0.99
Presentations & Reports www.profile.co.za/analytics.htm
196