
Page 194 - Profile's Stock Exchange Handbook -2024 Issue 4
P. 194
JSE – SIB Profile’s Stock Exchange Handbook: 2024 – Issue 4
Sibanye Stillwater Ltd. Sirius Real Estate Ltd.
SIB SIR
ISIN: ZAE000259701 SHORT: SIBANYE-S CODE: SSW ISIN: GG00B1W3VF54 SHORT: SIRIUS CODE: SRE
REG NO: 2014/243852/06 FOUNDED: 2002 LISTED: 2013 REG NO: 46442 FOUNDED: 2007 LISTED: 2014
NATURE OF BUSINESS: Sibanye-Stillwater is a multinational mining and NATURE OF BUSINESS: Sirius is a property company listed on the main
metals processing group with a diverse portfolio of projects and and premium market of the London Stock Exchange and the main board of
investments across five continents. The Group is also one of the foremost the JSE Ltd. It is a leading owner and operator of branded business and
global recyclers of PGM autocatalysts and has controlling interests in industrial parks providing conventional space and flexible workspace in
leading mine tailings retreatment operations. Germany and the UK. As of 31 March 2024, the Group’s portfolio had
SECTOR:BasicMaterials—BasicResrcs—PreciousMet&Min—Plat&PrecMet comprised 140 assets let to 9 201 tenants with a total book value of over
NUMBER OF EMPLOYEES: 84 481 EUR2.2 billion.
DIRECTORS: Boisseau P (ind ne), Cumming T (ind ne), SECTOR: RealEstate—RealEstate—REITS—Diversified
Dorward-King E (ind ne), Hancock P (ind ne), Kenyon-Slaney NUMBER OF EMPLOYEES: 416
H(ind ne, UK), MenellRP(ld ind ne), NikaNG(ind ne), Nombembe T DIRECTORS: Britton C (snr ind ne), Cherry M (ind ne),
(ind ne), RaynerKA(ind ne), van der Merwe S (ind ne), Vilakazi J S Cleveland K (ind ne), Kenrick J (ind ne), PeggieAJ(ld ind ne),
(ind ne), ZilwaSV(ind ne), Maphai Dr T V (Chair, ind ne), Kitchen D M (Chair, ne), Coombs A J (CEO), Bowman C (CFO)
Froneman N (CEO), Keyter C (CFO) MAJOR ORDINARY SHAREHOLDERS as at 25 Sep 2024
MAJOR ORDINARY SHAREHOLDERS as at 02 Oct 2024 BlackRock, Inc. 9.68%
Public Investment Corporation SOC Ltd. 15.05% Abrdn plc 7.67%
UBS Group AG 7.36% Public Investment Corporation (SOC) Ltd. 6.14%
Allan Gray 6.84% POSTAL ADDRESS: PO Box 119, St Peter Port, Guernsey, GY1 3HB
POSTAL ADDRESS: Private Bag X5, Westonaria, 1780 MORE INFO: www.sharedata.co.za/sdo/jse/SRE
MORE INFO: www.sharedata.co.za/sdo/jse/SSW COMPANY SECRETARY: Anthony Gallagher
COMPANY SECRETARY: Lerato Matlosa TRANSFER SECRETARY: Computershare Investor Services (Pty) Ltd.
TRANSFER SECRETARY: Computershare Investor Services (Pty) Ltd. SPONSOR: PSG Capital (Pty) Ltd.
SPONSOR: JP Morgan Equities South Africa Ltd. AUDITORS: Ernst & Young LLP
AUDITORS: Ernst & Young
CAPITAL STRUCTURE AUTHORISED ISSUED
CAPITAL STRUCTURE AUTHORISED ISSUED SRE Ords no par - 1 511 857 390
SSW Ords no par 10 000 000 000 2 830 567 264
DISTRIBUTIONS [EURc]
DISTRIBUTIONS [ZARc] Ords no par Ldt Pay Amt
Ords no par value Ldt Pay Amt Final No 19 25 Jun 24 25 Jul 24 3.05
Final No 8 4 Apr 17 10 Apr 17 60.00 Interim No 18 11 Dec 23 25 Jan 24 3.00
Interim No 7 20 Sep 16 26 Sep 16 85.00
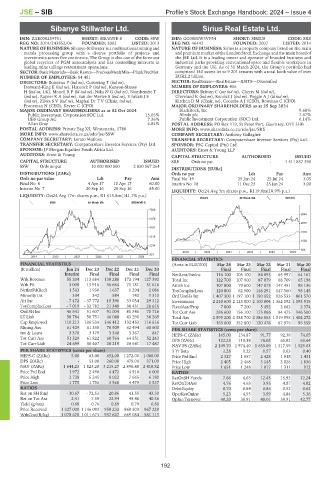
LIQUIDITY: Oct24 Avg 5m shares p.w., R119.0m(18.9% p.a.)
LIQUIDITY: Oct24 Avg 77m shares p.w., R1 615.8m(141.7% p.a.)
REDS 40 Week MA SIRIUS
MINI 40 Week MA SIBANYE-S
7360
2545
6079
2057
4797
1570
3516
1082
2234
594
2019 | 2020 | 2021 | 2022 | 2023 | 2024
953
2019 | 2020 | 2021 | 2022 | 2023 | 2024
FINANCIAL STATISTICS
FINANCIAL STATISTICS (Amts in EUR’000) Mar 24 Mar 23 Mar 22 Mar 21 Mar 20
(R million) Jun 24 Dec 23 Dec 22 Dec 21 Dec 20 Final Final Final Final Final
Interim Final Final Final Final NetRent/InvInc 116 100 105 100 84 093 65 997 64 167
Wrk Revenue 55 204 113 684 138 288 172 194 127 392 Total Inc 122 700 107 900 87 079 68 709 65 198
Wrk Pft 3 009 13 916 36 664 71 181 51 616 Attrib Inc 107 800 79 600 147 873 147 451 98 136
NetIntPd(Rcd) 1 543 1 930 1 637 1 294 2 086 TotCompIncLoss 120 800 62 500 146 291 147 560 98 145
Minority Int 334 342 584 742 1 310 Ord UntHs Int 1 407 300 1 197 100 1 190 652 926 533 801 570
Att Inc - 7 472 - 37 772 18 396 33 054 29 312 Investments 2 210 600 2 123 000 2 100 004 1 362 192 1 193 915
TotCompIncLoss - 7 019 - 32 782 21 349 38 431 28 616 FixedAss/Prop 7 800 7 200 5 492 2 682 2 374
Ord SH Int 46 541 51 607 91 004 81 345 70 716 Tot Curr Ass 286 600 156 100 175 866 84 475 146 500
LT Liab 58 784 50 751 46 048 43 290 38 269 Total Ass 2 595 200 2 388 700 2 386 863 1 519 998 1 402 272
Cap Employed 110 213 106 534 146 412 132 453 116 616 Tot Curr Liab 153 600 352 800 120 478 67 975 95 559
Mining Ass 61 429 61 338 76 909 62 494 60 600 PER SHARE STATISTICS (cents per share)
Inv & Loans 3 370 3 179 3 340 3 367 847 HEPS-C (ZARc) 165.00 134.87 91.77 92.38 74.05
Tot Curr Ass 51 529 61 822 60 764 64 551 52 243 DPS (ZARc) 122.25 110.38 76.02 65.82 63.64
Tot Curr Liab 24 699 36 407 20 219 20 541 17 487
NAV PS (ZARc) 2 109.70 1 974.40 1 655.09 1 317.59 1 529.03
PER SHARE STATISTICS (cents per share) 3 Yr Beta 1.28 1.22 0.57 0.63 0.40
HEPS-C (ZARc) 5.00 63.00 652.00 1 272.00 1 068.00 Price Prd End 2 327 1 657 2 428 1 818 1 431
DPS (ZARc) - 53.00 260.00 479.00 371.00 Price High 2 405 2 468 3 145 2 028 1 836
NAV (ZARc) 1 644.23 1 823.20 3 215.27 2 896.48 2 418.82 Price Low 1 651 1 248 1 817 1 311 912
Price Prd End 1 972 2 490 4 472 4 910 6 000 RATIOS
Price High 2 738 5 245 8 022 7 665 6 180 RetOnSH Funds 7.66 6.65 12.43 15.92 12.24
Price Low 1 775 1 756 3 568 4 479 1 537 RetOnTotAss 4.76 4.63 3.95 4.87 4.82
RATIOS Debt:Equity 0.70 0.84 0.86 0.52 0.62
Ret on SH fund - 30.67 - 72.53 20.86 41.55 43.30 OperRetOnInv 5.23 4.93 3.99 4.84 5.36
Ret on Tot Ass 2.41 7.59 22.94 49.48 40.36 OpInc:Turnover 40.20 38.91 40.01 39.91 42.77
Yield (g/ton) 0.68 0.76 0.69 0.79 0.80
Price Received 1 327 000 1 146 093 958 232 860 303 967 229
WrkCost(R/kg) 1 078 670 1 011 673 937 627 669 084 581 113
192