
Page 206 - shbh24_complete
P. 206
JSE – TRA Profile’s Stock Exchange Handbook: 2024 – Issue 3
Transpaco Ltd. Trellidor Holdings Ltd.
TRA TRE
ISIN: ZAE000007480 SHORT: TRNPACO CODE: TPC ISIN: ZAE000209342 SHORT: TRELLIDOR CODE: TRL
REG NO: 1951/000799/06 FOUNDED: 1940 LISTED: 1987 REG NO: 1970/015401/06 FOUNDED: 1970 LISTED: 2015
NATURE OF BUSINESS: Transpaco is listed in the ‘Containers and NATURE OF BUSINESS: Trellidor Holdings Ltd. is an investment entity
Packaging’ sector of the JSE Main Board. incorporated in South Africa. The company’s subsidiaries are engaged in
SECTOR: Inds—IndsGoods&Services—GeneralIndustr—Cont&Pckgng the manufacture and sale of custom-made barrier security products,
NUMBER OF EMPLOYEES: 1 593 blinds, decorative and security shutters and the importing and selling of
DIRECTORS: BothaHA(ind ne), Bouzaglou S R, MahlanguSY(ind ne), cornicing/skirting products.
van der Linde S (ld ind ne), ThomasDJJ (Chair, ne), Abelheim P SECTOR: Inds—Constr&Mats—Constr&Mats—BldngMats:Other
N (CEO), Weinberg L (CFO) NUMBER OF EMPLOYEES: 351
MAJOR ORDINARY SHAREHOLDERS as at 30 Jun 2023 DIRECTORS: Bird S (ind ne), PatmoreRB(ind ne),
CEPPWAWU Investments (Pty) Ltd. 22.25% Hodgson K (Chair, ind ne), Dennison T M (CEO), JudgeDJR (CFO)
Old Mutual Group 12.68% MAJOR ORDINARY SHAREHOLDERS as at 01 Dec 2023
PN Abelheim 11.74% Mazi Asset Management (Pty) Ltd. 12.39%
POSTAL ADDRESS: PO Box 39601, Bramley, 2018 Aylett and Company (Pty) Ltd. 8.89%
MORE INFO: www.sharedata.co.za/sdo/jse/TPC Peresec Prime Brokers (Pty) Ltd. 7.28%
COMPANY SECRETARY: H J van Niekerk POSTAL ADDRESS: PO Box 20173, Durban North, 4016
TRANSFER SECRETARY: Computershare Investor Services (Pty) Ltd. MORE INFO: www.sharedata.co.za/sdo/jse/TRL
SPONSOR: Investec Bank Ltd. COMPANY SECRETARY: Paula Nel
AUDITORS: BDO South Africa Inc. TRANSFER SECRETARY: Computershare Investor Services (Pty) Ltd.
SPONSOR: PSG Capital (Pty) Ltd.
CAPITAL STRUCTURE AUTHORISED ISSUED AUDITORS: Mazars
TPC Ords 1c ea 250 000 000 28 839 388
CAPITAL STRUCTURE AUTHORISED ISSUED
DISTRIBUTIONS [ZARc] TRL Ords no par value 5 000 000 000 95 209 820
Ords 1c ea Ldt Pay Amt
Interim No 49 12 Mar 24 18 Mar 24 80.00 DISTRIBUTIONS [ZARc]
Final No 47 19 Sep 23 26 Sep 23 175.00 Ords no par value Ldt Pay Amt
Final No 11 28 Sep 21 4 Oct 21 11.00
LIQUIDITY: Jul24 Avg 23 515 shares p.w., R716 976.1(4.2% p.a.)
Interim No 10 29 Mar 21 6 Apr 21 10.00
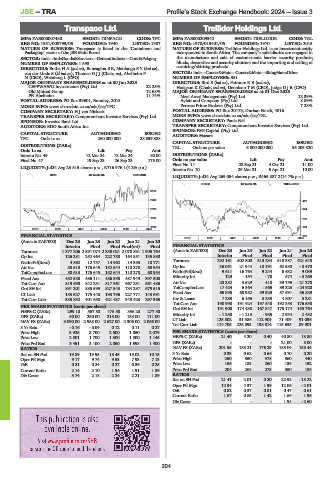
GENI 40 Week MA TRNPACO
LIQUIDITY: Jul24 Avg 269 054 shares p.w., R465 887.2(14.7% p.a.)
CONM 40 Week MA TRELLIDOR
3160
2645 419
2130 344
1615 269
1100 194
2019 | 2020 | 2021 | 2022 | 2023 | 2024
FINANCIAL STATISTICS 119
2019 | 2020 | 2021 | 2022 | 2023 | 2024
(Amts in ZAR’000) Dec 23 Jun 23 Jun 22 Jun 21 Jun 20
Interim Final Final Final(rst) Final FINANCIAL STATISTICS
Turnover 1 377 206 2 591 074 2 338 021 2 078 891 1 905 764 (Amts in ZAR’000) Dec 23 Jun 23 Jun 22 Jun 21 Jun 20
Op Inc 126 281 252 464 222 758 164 851 135 890 Interim Final Final Final Final
NetIntPd(Rcvd) 4 862 12 757 14 962 14 385 10 771 Turnover 292 161 502 300 513 234 518 387 421 548
Att Inc 88 613 176 645 152 644 110 278 68 954 Op Inc 36 051 21 944 10 191 62 530 - 8 470
TotCompIncLoss 88 613 176 645 152 644 110 278 68 954 NetIntPd(Rcvd) 9 611 16 764 9 244 6 632 9 039
Fixed Ass 482 588 486 111 486 898 487 949 397 508 Minority Int 129 - 154 - 78 574 - 3 269
Tot Curr Ass 819 690 842 231 817 961 667 281 561 486 Att Inc 20 282 3 629 418 39 755 - 21 270
Ord SH Int 891 201 885 595 827 543 734 297 679 515 TotCompIncLoss 17 424 6 364 - 565 39 325 - 24 920
LT Liab 153 627 175 448 193 796 227 771 143 691 Fixed Ass 66 895 68 982 59 929 57 591 56 829
Tot Curr Liab 383 852 401 658 421 437 349 423 297 365 Inv & Loans 7 283 6 456 3 253 4 807 3 281
Tot Curr Ass 190 998 191 924 197 548 192 353 176 638
PER SHARE STATISTICS (cents per share) Ord SH Int 191 900 174 438 167 847 176 174 158 764
HEPS-C (ZARc) 299.10 567.80 475.50 336.20 277.50 Minority Int - 1 250 - 1 213 - 985 2 934 2 432
DPS (ZARc) 80.00 260.00 215.00 153.00 111.00 LT Liab 125 502 31 386 112 904 71 409 91 036
NAV PS (ZARc) 3 090.00 2 958.00 2 627.00 2 306.00 2 066.00 Tot Curr Liab 114 705 225 893 138 814 115 635 89 901
3 Yr Beta - 0.16 - 0.09 0.12 0.11 0.27
Price High 3 925 3 700 2 600 1 850 2 079 PER SHARE STATISTICS (cents per share)
Price Low 2 501 1 700 1 300 1 300 1 145 HEPS-C (ZARc) 21.40 4.20 0.40 40.80 13.80
Price Prd End 3 451 3 100 2 050 1 598 1 400 DPS (ZARc) - - - 21.00 8.00
RATIOS NAV PS (ZARc) 201.55 183.21 176.29 185.04 158.44
Ret on SH Fnd 19.89 19.95 18.45 15.02 10.15 3 Yr Beta 0.33 0.62 0.66 0.70 0.20
Oper Pft Mgn 9.17 9.74 9.53 7.93 7.13 Price High 250 350 378 360 440
D:E 0.21 0.24 0.27 0.36 0.25 Price Low 156 183 260 136 152
Current Ratio 2.14 2.10 1.94 1.91 1.89 Price Prd End 204 268 275 350 186
Div Cover 3.74 2.18 2.24 2.21 1.89 RATIOS
Ret on SH Fnd 21.41 2.01 0.20 22.52 - 15.22
Oper Pft Mgn 12.34 4.37 1.99 12.06 - 2.01
D:E 0.82 0.37 0.81 0.47 0.61
Current Ratio 1.67 0.85 1.42 1.66 1.96
Div Cover - - - 1.94 - 2.60
204