
Page 202 - shbh24_complete
P. 202
JSE – SYG Profile’s Stock Exchange Handbook: 2024 – Issue 3
Sygnia Ltd. TeleMasters Holdings Ltd.
SYG TEL
ISIN: ZAE000208815 SHORT: SYGNIA CODE: SYG ISIN: ZAE000093324 SHORT: TELEMASTR CODE: TLM
REG NO: 2007/025416/06 FOUNDED: 2015 LISTED: 2015 REG NO: 2006/015734/06 FOUNDED: 2006 LISTED: 2007
NATURE OF BUSINESS: Sygnia is a financial services group based in South NATURE OF BUSINESS: TeleMasters Holdings Ltd. (“TeleMasters” or
Africa and the United Kingdom and listed on the Johannesburg Stock “the Group”) is a diversified technology investment company. Entities
Exchange and on the A2X exchange. The Group focuses on the provision of within the Group are complementary with a key focus on enhancing digital
investment management solutions and administration services to transformation, empowering next-generation interconnectivity and
institutional and retail clients located predominantly in South Africa. accelerating smart working environments. Our vision is to create and
SECTOR: Fins—FinServcs—InvBnkng&BrokerServcs—AssMgrs&Custodians accelerate shareholder value through responsible growth, acquisitions,
NUMBER OF EMPLOYEES: 291 and investments.
DIRECTORS: BhoratHI(ne), Boyd J (ind ne), Cavaleros G (ld ind ne), SECTOR: AltX
Corelli J, Jakoet A (ind ne), Wierzycki W, Wierzycka M F (Chair), Giles NUMBER OF EMPLOYEES: 0
N J (FD) DIRECTORS: Bate DrDJ(ind ne), Krastanov M (ind ne),
MAJOR ORDINARY SHAREHOLDERS as at 30 Sep 2023 Moela Adv M (ind ne), Steinberg F (ld ind ne), Tappan M (ind ne),
Sapayoa Investments (Pty) Ltd. 30.22% Pretorius M B (Chair, ne), Voigt J (CEO), Topham B (Interim CFO)
SJB Peile 29.50% MAJOR ORDINARY SHAREHOLDERS as at 30 Jun 2023
Clifford Street Holdings Ltd. 6.96% Maison d’Obsession Trust 62.11%
POSTAL ADDRESS: PO Box 51591, Waterfront, 8002 JM Voigt 14.98%
MORE INFO: www.sharedata.co.za/sdo/jse/SYG LP Pieton 8.70%
COMPANY SECRETARY: Leanne van Wyk POSTALADDRESS:Postnetsuite#51,PrivateBagX81,HalfwayHouse,1685
TRANSFER SECRETARY: Computershare Investor Services (Pty) Ltd. MORE INFO: www.sharedata.co.za/sdo/jse/TLM
SPONSOR: Standard Bank of South Africa Ltd. COMPANY SECRETARY: Sascha Ramirez-Victor
AUDITORS: Mazars TRANSFER SECRETARY: JSE Investor Services (Pty) Ltd.
DESIGNATED ADVISOR: AcaciaCap Advisors Sponsors (Pty) Ltd.
CAPITAL STRUCTURE AUTHORISED ISSUED
SYG Ords no par value 500 000 000 151 278 489 AUDITORS: Nexia SAB&T Inc.
CAPITAL STRUCTURE AUTHORISED ISSUED
DISTRIBUTIONS [ZARc] TLM Ords 0.01c ea 500 000 000 57 482 830
Ords no par value Ldt Pay Amt
Interim No 18 25 Jun 24 1 Jul 24 90.00 DISTRIBUTIONS [ZARc]
Final No 17 19 Dec 23 27 Dec 23 123.00 Ords 0.01c ea Ldt Pay Amt
Quarterly No 64 23 Jul 24 29 Jul 24 0.10
LIQUIDITY: Jul24 Avg 152 573 shares p.w., R2.9m(5.2% p.a.)
Interim No 63 16 Apr 24 22 Apr 24 0.00
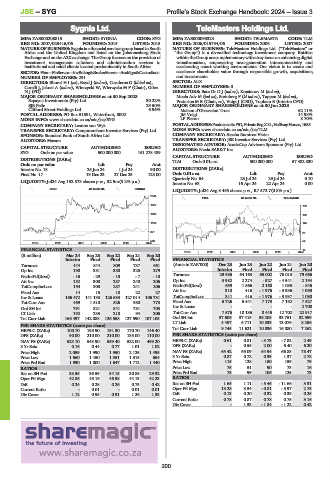
GENF 40 Week MA SYGNIA
LIQUIDITY: Jul24 Avg 8 455 shares p.w., R7 572.7(0.8% p.a.)
2145
FTEL 40 Week MA TELEMASTR
1827 198
1508 162
1190 125
871 89
553 52
2019 | 2020 | 2021 | 2022 | 2023 | 2024
FINANCIAL STATISTICS 16
2019 | 2020 | 2021 | 2022 | 2023 | 2024
(R million) Mar 24 Sep 23 Sep 22 Sep 21 Sep 20
Interim Final Final Final Final FINANCIAL STATISTICS
Turnover 444 844 809 737 661 (Amts in ZAR’000) Dec 23 Jun 23 Jun 22 Jun 21 Jun 20
Op Inc 190 381 380 325 279 Interim Final Final Final Final
NetIntPd(Rcvd) - 16 -29 - 15 -7 -10 Turnover 29 986 64 163 65 002 76 013 79 666
Att Inc 152 300 287 240 206 Op Inc 3 982 2 274 - 527 - 4 541 2 194
TotCompIncLoss 154 303 287 241 206 NetIntPd(Rcvd) 659 1 566 2 168 1 085 - 846
Fixed Ass 14 15 18 22 27 Att Inc 310 416 - 1 976 - 3 936 1 090
Inv & Loans 166 472 141 133 126 633 127 014 106 731 TotCompIncLoss 311 416 - 1 976 - 3 937 1 090
Tot Curr Ass 469 1 510 526 980 773 Fixed Ass 6 726 6 441 7 173 7 192 7 527
Ord SH Int 791 821 841 781 703 Inv & Loans - - - - 2 700
LT Liab 192 233 218 94 206 Tot Curr Ass 7 576 10 136 8 445 12 702 22 917
Tot Curr Liab 166 497 142 088 126 558 127 590 107 105 Ord SH Int 37 606 37 415 36 208 33 751 32 959
LT Liab 4 457 6 711 10 839 13 076 8 256
PER SHARE STATISTICS (cents per share) Tot Curr Liab 9 745 11 621 10 836 16 880 7 262
HEPS-C (ZARc) 100.70 198.90 191.30 170.70 146.40
DPS (ZARc) 90.00 210.00 210.00 135.00 110.00 PER SHARE STATISTICS (cents per share)
NAV PS (ZARc) 523.10 543.90 559.40 522.00 499.20 HEPS-C (ZARc) 0.61 0.81 - 3.73 - 7.82 2.49
3 Yr Beta 0.16 0.44 0.77 1.01 1.02 DPS (ZARc) - 0.55 2.00 6.40 6.20
Price High 2 059 1 990 1 950 2 125 1 495 NAV PS (ZARc) 65.42 65.09 64.94 66.83 78.47
Price Low 1 660 1 450 1 351 1 315 654 3 Yr Beta 0.87 0.72 0.39 1.37 2.78
Price Prd End 1 930 1 800 1 647 1 712 1 440 Price High 115 128 150 159 79
RATIOS Price Low 75 51 90 73 16
Ret on SH Fnd 38.55 36.59 34.15 30.85 29.32 Price Prd End 75 99 106 125 73
Oper Pft Mgn 42.86 45.16 46.98 44.13 42.23 RATIOS
D:E 0.24 0.28 0.26 0.73 0.42 Ret on SH Fnd 1.65 1.11 - 5.46 - 11.66 3.31
Current Ratio - 0.01 - 0.01 0.01 Oper Pft Mgn 13.28 3.54 - 0.81 - 5.97 2.75
Div Cover 1.12 0.95 0.91 1.26 1.33 D:E 0.13 0.20 0.32 0.39 0.25
Current Ratio 0.78 0.87 0.78 0.75 3.16
Div Cover - 1.33 - 1.84 - 1.22 0.42
200