
Page 211 - shbh24_complete
P. 211
Profile’s Stock Exchange Handbook: 2024 – Issue 3 JSE – VUK
Vukile Property Fund Ltd. Vunani Ltd.
VUK VUN
ISIN: ZAE000056370 SHORT: VUKILE CODE: VKE ISIN: ZAE000163382 SHORT: VUNANI CODE: VUN
REG NO: 2002/027194/06 FOUNDED: 2004 LISTED: 2004 REG NO: 1997/020641/06 FOUNDED: 1997 LISTED: 2007
NATURE OF BUSINESS: Vukile Property Fund Ltd. (Vukile, the company NATURE OF BUSINESS:Vunani is a diversified black-ownedand operated
or the group) is a high-quality, low-risk retail focused Real Estate financial services company with a unique position in the South African
Investment Trust (REIT), which listed on the JSE Ltd. on 24 June 2004 and financial services sector. Vunani has established itself as one of the
on the Namibian Stock Exchange on 11 July 2007. country’s premier boutique providers, led by individuals with a love for
Vukile’s market capitalisation was R13.8 billion on 31 March 2022 and its business. Its stable operating foundationunderpinsaninnovativeandfully
direct property portfolio was valued at R30.8 billion at year-end. integrated suite of products and services that can be tailored and bundled
SECTOR: RealEstate—RealEstate—REITS—Retail to meet the demands of public and private sector clients.
NUMBER OF EMPLOYEES: 47 SECTOR:Fins—FinServcs—InvBnkng&BrokerServcs—InvestmentServices
DIRECTORS: DongwanaNP(ind ne), Formby J (ind ne), NUMBER OF EMPLOYEES: 371
Zehner J (ind ne), Pottas L (FD), Rapp L (CEO), Mothibeli I, DIRECTORS: Anderson N M, GoldingMJA(ne), Khoza B M,
Payne N G (Chair, ind ne), Booysen DrSF(ind ne), KodisangBM(ne), Macey J (ind ne), MazwiNS(ind ne), Mthethwa S (ne), Nzalo G (ind ne),
Mokate DrRD(ld ind ne), Mokgabudi T (ind ne), Moseneke DrGS(ne), Jacobs L I (Chair, ind ne), Dube E G (Group CEO), Mika T (CFO)
Ntene H (ind ne) MAJOR ORDINARY SHAREHOLDERS as at 29 Feb 2024
MAJOR ORDINARY SHAREHOLDERS as at 10 Jul 2024 Bambelela Capital (Pty) Ltd. 49.20%
Public Investment Corporation SOC Ltd. 20.22% Geomer Investments (Pty) Ltd. 18.60%
Eskom Pension and Provident Fund 4.97% POSTAL ADDRESS: PO Box 652419, Benmore, 2010
Old Mutual 4.23% MORE INFO: www.sharedata.co.za/sdo/jse/VUN
POSTAL ADDRESS: PO Box 2779, Saxonworld, 2132 COMPANY SECRETARY: CIS Company Secretaries (Pty) Ltd.
MORE INFO: www.sharedata.co.za/sdo/jse/VKE TRANSFER SECRETARY: Singular Systems (Pty) Ltd.
COMPANY SECRETARY: Johann Neethling SPONSOR: Vunani Sponsors
TRANSFER SECRETARY: JSE Investor Services (Pty) Ltd. AUDITORS: BDO South Africa Inc.
SPONSOR: Java Capital (Pty) Ltd. CAPITAL STRUCTURE AUTHORISED ISSUED
AUDITORS: PwC Inc.
VUN Ords no par value 500 000 000 161 155 915
CAPITAL STRUCTURE AUTHORISED ISSUED
VKE Ords no par 1 500 000 000 1 141 698 329 DISTRIBUTIONS [ZARc]
Ords no par value Ldt Pay Amt
DISTRIBUTIONS [ZARc] Final No 14 9 Jul 24 15 Jul 24 9.00
Ords no par Ldt Pay Amt Interim No 13 21 Nov 23 27 Nov 23 9.00
Final No 40 25 Jun 24 1 Jul 24 72.18
Interim No 39 19 Dec 23 27 Dec 23 52.07 LIQUIDITY: Jul24 Avg 154 204 shares p.w., R328 714.8(5.0% p.a.)
GENF 40 Week MA VUNANI
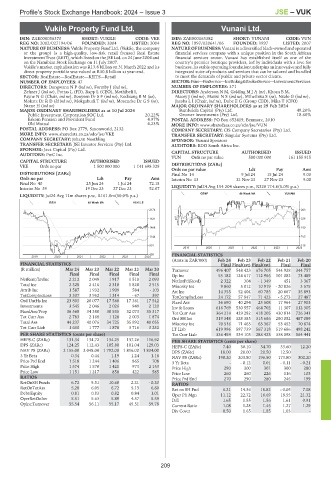
LIQUIDITY: Jul24 Avg 11m shares p.w., R161.0m(50.0% p.a.)
REIV 40 Week MA VUKILE
2174 263
1831 226
1488 190
1144 153
801 116
2019 | 2020 | 2021 | 2022 | 2023 | 2024
458 FINANCIAL STATISTICS
2019 | 2020 | 2021 | 2022 | 2023 | 2024
(Amts in ZAR’000) Feb 24 Feb 23 Feb 22 Feb 21 Feb 20
FINANCIAL STATISTICS Final Final(rst) Final(rst) Final Final
(R million) Mar 24 Mar 23 Mar 22 Mar 21 Mar 20 Turnover 496 407 548 423 676 705 544 928 344 757
Final Final Final Final Final Op Inc 55 182 124 617 112 965 101 082 73 489
NetRent/InvInc 2 212 2 049 1 917 1 510 2 093 NetIntPd(Rcvd) 2 322 304 - 1 349 451 3 367
Total Inc 2 328 2 416 2 310 1 828 2 515
Minority Int 9 860 5 012 10 919 - 20 826 3 575
Attrib Inc 1 587 1 932 1 909 584 - 103 Att Inc 14 355 52 404 60 785 20 667 35 893
TotCompIncLoss 3 337 3 952 1 314 - 67 397 TotCompIncLoss 24 172 57 947 71 423 - 5 273 27 487
Ord UntHs Int 23 803 20 077 17 568 17 361 17 542 Fixed Ass 36 690 40 294 23 508 17 964 27 903
Investments 3 545 2 046 2 026 949 2 120 Inv & Loans 616 769 530 557 464 702 11 307 112 305
FixedAss/Prop 36 568 34 380 30 535 32 073 35 317 Tot Curr Ass 364 214 429 282 418 205 430 814 726 341
Tot Curr Ass 2 783 2 168 1 128 2 003 1 874 Ord SH Int 319 348 328 385 315 686 280 052 487 089
Total Ass 44 237 40 076 34 725 35 992 40 055 Minority Int 70 516 71 465 65 367 53 452 70 674
Tot Curr Liab 1 630 1 777 1 878 3 716 3 232
LT Liab 619 996 597 739 567 318 519 686 498 242
PER SHARE STATISTICS (cents per share) Tot Curr Liab 336 454 334 105 288 423 338 098 564 441
HEPS-C (ZARc) 131.34 134.72 134.25 137.26 116.92 PER SHARE STATISTICS (cents per share)
DPS (ZARc) 124.25 112.43 105.80 101.04 129.03 HEPS-C (ZARc) 7.40 30.10 34.70 33.60 12.20
NAV PS (ZARc) 2 155.00 2 048.00 1 792.00 1 816.00 1 834.00 DPS (ZARc) 18.00 20.00 20.50 12.50 -
3 Yr Beta 0.34 0.44 1.19 1.24 1.16 NAV PS (ZARc) 198.20 203.80 196.50 173.80 302.20
Price Prd End 1 518 1 244 1 406 865 708 3 Yr Beta - - 0.12 0.01 - 0.11 - 0.21
Price High 1 574 1 570 1 421 973 2 153 Price High 290 300 301 300 280
Price Low 1 151 1 217 858 422 585 Price Low 260 260 226 116 103
RATIOS Price Prd End 270 290 280 245 199
RetOnSH Funds 6.72 9.51 10.68 2.21 - 0.20 RATIOS
RetOnTotAss 5.28 6.05 6.72 5.13 6.60 Ret on SH Fnd 6.21 14.36 18.82 - 0.05 7.08
Debt:Equity 0.81 0.83 0.82 0.84 1.01 Oper Pft Mgn 11.12 22.72 16.69 18.55 21.32
OperRetOnInv 5.51 5.63 5.89 4.57 5.59 D:E 1.65 1.55 1.56 1.61 0.91
OpInc:Turnover 55.54 56.11 55.17 49.51 59.78
Current Ratio 1.08 1.28 1.45 1.27 1.29
Div Cover 0.50 1.65 1.85 1.03 -
209