
Page 210 - Profile's Stock Exchange Handbook - 2025 Issue 3
P. 210
JSE - VAL Profile’s Stock Exchange Handbook: 2025 - Issue 3
Valterra Platinum Ltd. Visual International Holdings Ltd.
ISIN: ZAE000013181 SHORT: VALTERRA CODE: VAL ISIN: ZAE000187407 SHORT: VISUAL CODE: VIS
REG NO: 1946/022452/06 FOUNDED: 1946 LISTED: 1977 REG NO: 2006/030975/06 FOUNDED: 2006 LISTED: 2014
NATURE OF BUSINESS: Valterra is listed on the JSE Ltd. and NATURE OF BUSINESS: Visual is a property development company
headquartered in Johannesburg, South Africa. Our majority with its head office in the northern suburbs of Cape Town. Visual
shareholder is Anglo American plc. We focus on extracting value focuses on all aspects of property development and is proud
from all the PGMs and base metals we mine – metals that make to have been involved with numerous successful residential,
modern life possible in safe, smart and responsible ways. commercial and retail projects.
SECTOR: Basic Materials--Basic Resrcs--PreciousMet&Min--Plat&PrecMet SECTOR: RealEstate--RealEstate--InvestmentServices--Holdings
NUMBER OF EMPLOYEES: 24 603 NUMBER OF EMPLOYEES: 3
DIRECTORS: Bam L L (ind ne), Brewer T (ind ne), Dixon R (ind ne), DIRECTORS: Matlholwa L (ne), Vorster T (ind ne), Richards Dr R
Emmett D T G (ind ne), Faul H (ind ne), Kana Dr S P (ind ne), (Chair, ind ne), Robertson C K (CEO), Kadalie R (Acting CFO)
Peterson-Cook F (ind ne), Phiri S D (ne), Mbazima N B (Chair, ind ne), MAJOR ORDINARY SHAREHOLDERS as at 3 Mar 2025
Moosa M V (Chair, ind ne), Miller C (CEO), Naidoo S (CFO) CKR Investment Trust 39.34%
MAJOR ORDINARY SHAREHOLDERS as at 13 Jun 2025 RAL Trust 18.85%
Anglo American International Ltd. 15.51% UJobs (Pty) Ltd. 13.36%
Public Investment Corporation (SOC) Ltd. 11.15% POSTAL ADDRESS: PO Box 3163, Tyger Valley, 7536
BlackRock Inc 5.00% MORE INFO: www.sharedata.co.za/sdo/jse/VIS
POSTAL ADDRESS: Postnet Suite Number 153, Private Bag X31, COMPANY SECRETARY: Light Consulting (Pty) Ltd.
Saxonwold, 2132 TRANSFER SECRETARY: JSE Investor Services (Pty) Ltd.
MORE INFO: www.sharedata.co.za/sdo/jse/VAL SPONSOR: AcaciaCap Advisors (Pty) Ltd.
COMPANY SECRETARY: Fiona Edmundson AUDITORS: Moore Infinity Inc.
TRANSFER SECRETARY: Computershare Investor Services (Pty) Ltd. CAPITAL STRUCTURE Authorised Issued
SPONSOR: Merrill Lynch SA (Pty) Ltd. VIS Ords no par value 5 000 000 000 1 109 116 671
AUDITORS: PwC Inc.
CAPITAL STRUCTURE Authorised Issued LIQUIDITY: Jul25 Avg 832 480 shares p.w., R22 455.5(3.9% p.a.)
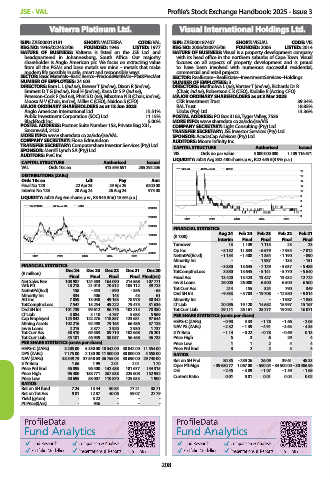
VAL Ords 10c ea 413 595 651 265 292 206 VISUAL 40 Week MA REDS
18
DISTRIBUTIONS [ZARc] 16
Ords 10c ea Ldt Pay Amt 14
Final No 129 22 Apr 25 29 Apr 25 6200.00 12
Interim No 128 20 Aug 24 26 Aug 24 975.00 10
LIQUIDITY: Jul25 Avg 6m shares p.w., R3 945.3m(115.6% p.a.) 8
6
VALTERRA 40 Week MA MINI 4
300000
2
250000 0
2021 2022 2023 2024 2025
200000
FINANCIAL STATISTICS
Aug 24 Feb 24 Feb 23 Feb 22 Feb 21
150000 (R ’000)
Interim Final Final Final Final
100000 Turnover 13 1 109 1 115 23 23
Op Inc - 5 152 11 833 - 6 579 - 7 935 - 7 012
50000
2021 2022 2023 2024 2025 NetIntPd(Rcvd) - 1 154 - 1 408 - 1 354 - 1 190 - 890
Minority Int - - 1 987 - 133 - 151
FINANCIAL STATISTICS Att Inc - 3 830 13 645 - 7 129 - 5 637 - 5 488
Dec 24 Dec 23 Dec 22 Dec 21 Dec 20 TotCompIncLoss 3 830 13 645 - 5 141 - 5 770 - 5 640
(R million)
Final Final Final Final Final(rst) Fixed Ass 13 420 13 423 13 427 13 432 12 722
Net Sales Rev 108 987 124 583 164 090 214 568 107 771 Inv & Loans 26 000 26 000 6 500 6 500 6 500
Wrk Pft 18 218 21 013 70 512 105 112 39 723 Tot Curr Ass 214 155 324 790 349
NetIntPd(Rcd) 158 - 553 - 590 - 356 - 65
Minority Int 334 406 143 43 61 Ord SH Int - 9 533 - 5 703 - 19 708 - 12 580 - 9 814
Att Inc 7 059 13 040 49 153 78 978 30 342 Minority Int - - - - 1 987 - 1 853
TotCompIncLoss 7 547 15 254 49 222 79 475 31 636 LT Liab 20 056 19 120 14 682 15 997 15 167
Ord SH Int 101 739 99 612 96 776 102 213 78 350 Tot Curr Liab 29 111 26 161 25 277 19 292 16 071
LT Liab 3 084 3 110 4 757 5 683 5 969 PER SHARE STATISTICS (cents per share)
Cap Employed 125 842 122 276 118 857 123 681 97 644 HEPS-C (ZARc) - 0.93 3.33 - 1.78 - 1.66 - 2.05
Mining Assets 102 216 92 498 79 165 66 486 57 128
Inv & Loans 2 215 3 377 2 920 2 930 1 737 NAV PS (ZARc) - 2.32 - 1.39 - 4.91 - 3.63 - 4.35
Tot Curr Ass 58 410 69 583 89 710 102 668 76 201 3 Yr Beta - 1.14 - 0.22 - 0.78 - 0.69 0.13
Tot Curr Liab 45 101 46 939 58 057 56 468 46 733 Price High 5 3 6 29 4
PER SHARE STATISTICS (cents per share) Price Low 1 1 2 4 4
HEPS-C (ZARc) 3 205.00 5 330.00 18 542.00 30 042.00 11 554.00 Price Prd End 3 2 2 5 4
DPS (ZARc) 7 175.00 2 130.00 11 500.00 30 000.00 4 558.00 RATIOS
NAV (ZARc) 38 349.79 37 548.03 36 755.03 38 690.00 29 740.00 Ret on SH Fnd 80.35 - 239.26 26.09 39.61 48.33
3 Yr Beta 1.66 1.99 2.01 2.01 1.70 Oper Pft Mgn - 39 630.77 1 067.00 - 590.04 - 34 500.00 - 30 486.96
Price Prd End 56 895 96 400 142 488 181 677 144 315
Price High 96 400 158 771 267 538 225 608 152 952 D:E - 2.45 - 3.89 - 1.07 - 1.39 - 1.68
Price Low 50 695 58 007 110 870 125 633 1 900 Current Ratio 0.01 0.01 0.01 0.04 0.02
RATIOS
Ret on SH fund 7.24 13.44 50.84 77.21 38.71
Ret on Tot Ass 9.81 12.87 40.06 59.07 27.79
Yield (g/ton) - 3.22 - - -
Pt Price($/oz) - 946 - - -
208