
Page 108 - Profile's Stock Exchange Handbook - 2025 Issue 3
P. 108
JSE - DIS Profile’s Stock Exchange Handbook: 2025 - Issue 3
Discovery Ltd. DRDGOLD Ltd.
ISIN: ZAE000022331 SHORT: DISCOVERY CODE: DSY ISIN: ZAE000058723 SHORT: DRDGOLD CODE: DRD
ISIN: ZAE000158564 SHORT: DSY B PREF CODE: DSBP REG NO: 1895/000926/06 FOUNDED: 1895 LISTED: 1895
REG NO: 1999/007789/06 FOUNDED: 1992 LISTED: 1999 NATURE OF BUSINESS: DRDGOLD is a South Africa-based world
NATURE OF BUSINESS: Discovery is a South African-founded leader in large-scale mechanised, on surface ‘mining’, focused on
diversified financial services organisation that operates in health environmental sustainability and operations efficiency. We have
insurance, life insurance, long-term savings and investments, two wholly-owned operations located on the world-renowned
short-term and commercial insurance, banking and behaviour- Witwatersrand Basin: Ergo and FWGR. The Company is South
change programmes. Africa’s oldest continuously listed mining company still in operation,
SECTOR: Fins--Insurance--Life Insurance--Life Insurance established in 1895. It is also listed on the NYSE.
NUMBER OF EMPLOYEES: 13 800 SECTOR: Basic Materials--Basic Resrcs--Precious Met & Min--Gold Min
DIRECTORS: Chiume L (ind ne), Farber R (ne), Hlahla M (ind ne), NUMBER OF EMPLOYEES: 903
Khanyile F N (ne), Macready D (ind ne), Ramon C (ind ne), DIRECTORS: Brady A R (ind ne), Cumming T (ne), Fleming C (ind ne),
Schreuder M (ind ne), Swartzberg B, van Kralingen B (ind ne), Holtzhausen J A (ind ne), Jeneker E A (ld ind ne), Lebina K P (ind ne),
Tucker M (Chair, ind ne), Gore A (CEO), Viljoen D M (Group CFO) Mnyango T (ind ne), Hooijer H (CFO Designate), Pretorius N (CEO),
MAJOR ORDINARY SHAREHOLDERS as at 6 Aug 2024 Davel R (CFO)
OUTsurance Group Ltd. 25.00% MAJOR ORDINARY SHAREHOLDERS as at 13 Nov 2024
Remgro Ltd. 7.90% Sibanye Gold (Pty) Ltd. 50.10%
Government Employees Pension Fund 7.87% The Bank of New York Mellon DR 27.34%
POSTAL ADDRESS: PO Box 786722, Sandton, 2146 Public Investment Corporation (SOC) Ltd. 5.29%
MORE INFO: www.sharedata.co.za/sdo/jse/DSY POSTAL ADDRESS: PO Box 390, Maraisburg, 1700
COMPANY SECRETARY: Ayanda Ceba MORE INFO: www.sharedata.co.za/sdo/jse/DRD
TRANSFER SECRETARY: Computershare Investor Services (Pty) Ltd. COMPANY SECRETARY: Kgomotso Mbanyele
SPONSOR: Nedbank Ltd. TRANSFER SECRETARY: JSE Investor Services (Pty) Ltd.
AUDITORS: PwC Inc. SPONSOR: One Capital
CAPITAL STRUCTURE Authorised Issued AUDITORS: KPMG Inc.
DSY Ords 0.1c ea 1 000 000 000 679 680 841 CAPITAL STRUCTURE Authorised Issued
DSBP B Prefs R100 ea 20 000 000 8 000 000 DRD Ords no par value 1 500 000 000 864 588 711
DISTRIBUTIONS [ZARc] DISTRIBUTIONS [ZARc]
Ords 0.1c ea Ldt Pay Amt Ords no par value Ldt Pay Amt
Interim No 32 25 Mar 25 31 Mar 25 87.00 Interim No 27 11 Mar 25 17 Mar 25 30.00
Final No 31 15 Oct 24 21 Oct 24 152.00 Final No 26 10 Sep 24 16 Sep 24 20.00
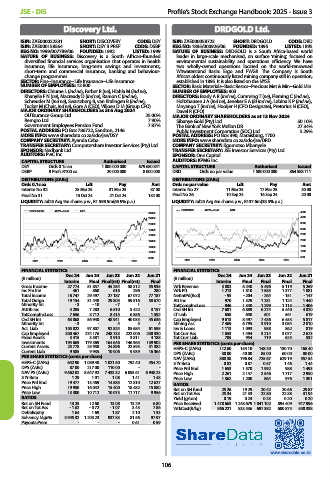
LIQUIDITY: Jul25 Avg 9m shares p.w., R1 598.5m(65.9% p.a.) LIQUIDITY: Jul25 Avg 6m shares p.w., R137.6m(38.5% p.a.)
DISCOVERY 40 Week MA LIFE DRDGOLD 40 Week MA MINI
24000 4500
22000 4000
20000 3500
18000 3000
16000 2500
14000 2000
12000 1500
10000 1000
8000 500
2021 2022 2023 2024 2025 2021 2022 2023 2024 2025
FINANCIAL STATISTICS FINANCIAL STATISTICS
Dec 24 Jun 24 Jun 23 Jun 22 Jun 21 Dec 24 Jun 24 Jun 23 Jun 22 Jun 21
(R million) Interim Final Final(rst) Final(rst) Final (R million) Interim Final Final Final Final
Gross Income 27 774 51 857 45 254 58 312 55 935 Wrk Revenue 3 802 6 240 5 496 5 119 5 269
Inc Fm Inv 461 860 616 296 280 Wrk Pft 1 213 1 810 1 585 1 377 1 881
Total Income 16 747 29 497 27 187 67 072 77 187 NetIntPd(Rcd) - 95 - 204 - 264 - 151 - 147
Total Outgo 19 154 31 448 29 805 59 516 58 670 Att Inc 970 1 329 1 281 1 124 1 440
Minority Int - 3 - 10 - 7 1 - TotCompIncLoss 946 1 340 1 299 1 115 1 406
Attrib Inc 4 285 7 283 6 510 5 422 3 157 Ord SH Int 7 681 6 889 6 274 5 440 4 820
TotCompIncLoss 7 656 8 712 8 415 6 856 1 592 LT Liab 658 650 601 561 619
Ord SH Int 63 868 56 940 48 941 40 035 45 636 Cap Employed 9 613 8 497 7 436 6 453 5 817
Minority Int - 3 - 4 5 4 Mining Ass 7 469 6 795 3 910 3 084 2 810
Act. Liab 105 822 97 807 92 824 85 684 61 595 Inv & Loans 1 113 1 093 958 862 819
Cap Employed 300 467 274 176 248 733 222 006 230 330 Tot Curr Ass 1 653 1 494 3 214 3 077 2 673
Fixed Assets 3 415 3 581 3 910 3 811 4 188 Tot Curr Liab 705 954 719 625 532
Investments 194 669 179 369 164 646 146 965 139 902 PER SHARE STATISTICS (cents per share)
Current Assets 25 778 25 950 24 896 22 593 31 382 HEPS-C (ZARc) 112.60 154.10 148.20 130.70 168.40
Current Liab 9 585 9 935 10 006 9 939 16 364 DPS (ZARc) 30.00 40.00 85.00 60.00 80.00
PER SHARE STATISTICS (cents per share) NAV (ZARc) 888.38 796.84 725.67 629.19 557.54
HEPS-C (ZARc) 642.90 1 089.40 1 021.50 792.40 454.70 3 Yr Beta 0.82 0.87 0.57 1.46 1.44
DPS (ZARc) 87.00 217.00 110.00 - - Price Prd End 1 653 1 570 1 992 988 1 493
NAV PS (ZARc) 9 662.02 8 647.92 7 433.32 6 093.61 6 948.23 Price High 2 261 2 147 2 546 1 717 2 950
3 Yr Beta 1.29 1.01 1.08 1.41 1.48 Price Low 1 362 1 200 864 976 1 301
Price Prd End 19 477 13 469 14 585 12 810 12 627 RATIOS
Price High 19 950 16 042 15 400 18 482 15 880 Ret on SH fund 25.26 19.29 20.42 20.66 29.87
Price Low 13 300 10 712 10 073 11 717 9 956 Ret on Tot Ass 25.34 21.33 22.80 22.88 31.94
RATIOS Yield (g/ton) 0.19 0.23 0.23 0.20 0.20
Ret on SH Fund 13.25 12.60 13.08 13.29 6.80 Price Received 1 478 663 1 248 679 1 041 102 894 409 917 996
Ret on Tot Ass - 1.62 - 0.72 - 1.07 3.43 7.86 WrkCost(R/kg) 866 221 833 536 697 382 600 875 540 338
Debt:Equity 1.64 1.69 1.87 2.10 1.33
Solvency Mgn% 3 945.32 1 203.23 937.83 81.56 97.97
Payouts:Prem - - - 0.61 0.59
www.sharedata.co.za
106