
Page 106 - Profile's Stock Exchange Handbook - 2025 Issue 3
P. 106
JSE - DEN Profile’s Stock Exchange Handbook: 2025 - Issue 3
Deneb Investments Ltd. Deutsche Konsum REIT-AG
ISIN: ZAE000197398 SHORT: DENEB CODE: DNB ISIN: DE000A14KRD3 SHORT: DKR CODE: DKR
REG NO: 2013/091290/06 FOUNDED: 2013 LISTED: 2014 REG NO: HRB 13072 FOUNDED: 2008 LISTED: 2021
NATURE OF BUSINESS: Deneb Investments Ltd. is a diverse NATURE OF BUSINESS: Deutsche Konsum REIT-AG, Broderstorf, is
investment company operating in southern Africa and is listed on a listed real estate company focusing on German retail properties
the JSE under the Financial Services - Speciality Finance sector. for everyday goods in established micro-locations. The focus of
SECTOR: Fins--FinServcs--InvBnkng&BrokerServcs-- DiversFinServcs the Company’s activities is on the acquisition, management and
NUMBER OF EMPLOYEES: 2 581 development of local retail properties with the aim of achieving a
DIRECTORS: Ahmed M H (ld ind ne), Govender T G (ne), Jappie N steady increase in value and the lifting of hidden reserves. Due to its
(ind ne), Mahloma F K (ind ne), Shaik Y (ne), Copelyn J A (Chair, ne), German REIT status (‘Real Estate Investment Trust’), the Company
Queen S A (CEO), Duncan D (COO), Wege G (FD) is exempt from German corporation and trade tax. The shares of
MAJOR ORDINARY SHAREHOLDERS as at 31 Mar 2025 the Company are listed on the Prime Standard of Deutsche Börse
Hosken Consolidated Investments Ltd. 69.30% (ISIN: DE 000A14KRD3) and on the JSE (South Africa) by way of a
Fulela Trade and Invest 81 (Pty) Ltd. 15.50% secondary listing.
POSTAL ADDRESS: PO Box 1585, Cape Town, 8000 SECTOR: RealEstate--RealEstate--REITS--Retail
MORE INFO: www.sharedata.co.za/sdo/jse/DNB NUMBER OF EMPLOYEES: 20
COMPANY SECRETARY: Cheryl Philips DIRECTORS: Boot J C G (ne), Elgeti R (ne), Lubitz A (ne), Wasser S
TRANSFER SECRETARY: Computershare Investor Services (Pty) Ltd. (Chair, ne), Betz A (Dep Chair, ne), Wittan L (CIO), Hellmuth C (CFO)
SPONSOR: PSG Capital (Pty) Ltd. MAJOR ORDINARY SHAREHOLDERS as at 5 Jun 2025
AUDITORS: PwC Inc. Weiterer Streubesitz 40.20%
CAPITAL STRUCTURE Authorised Issued Obotritia-Gruppe 25.64%
DNB Ords no par val 10 000 000 000 441 877 560 Versorgungsanstalt des Bundes und der Länder 15.91%
MORE INFO: www.sharedata.co.za/sdo/jse/DKR
DISTRIBUTIONS [ZARc] COMPANY SECRETARY: (Vacant)
Ords no par val Ldt Pay Amt TRANSFER SECRETARY: Computershare Investor Services (Pty) Ltd.
Final No 10 17 Jun 25 23 Jun 25 11.00 SPONSOR: PSG Capital (Pty) Ltd.
Share Premium No 9 11 Jun 24 18 Jun 24 10.00 AUDITORS: DOMUS AG Berlin
LIQUIDITY: Jul25 Avg 48 886 shares p.w., R106 413.5(0.6% p.a.) CAPITAL STRUCTURE Authorised Issued
DKR Ords no par val - 50 351 091
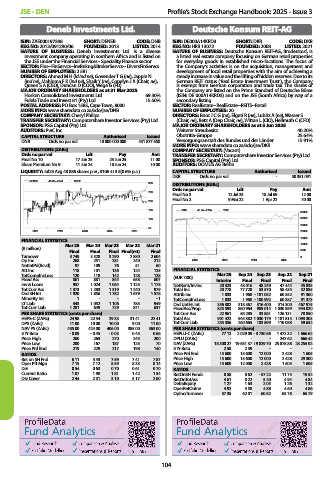
DENEB 40 Week MA GENF
300
DISTRIBUTIONS [EURc]
Ords no par val Ldt Pay Amt
250
Final No 3 12 Jul 23 18 Jul 69 12.00
200 Final No 2 9 Mar 22 1 Apr 22 40.00
150 DKR 40 Week MA REIV
35000
100 30000
25000
50
2021 2022 2023 2024 2025 20000
15000
FINANCIAL STATISTICS
(R million) Mar 25 Mar 24 Mar 23 Mar 22 Mar 21 10000
Final Final Final Final(rst) Final 5000
Turnover 3 749 3 528 3 290 2 880 2 604 0
Op Inc 268 251 281 240 212 2022 2023 2024 2025
NetIntPd(Rcvd) 97 109 76 51 60
Att Inc 118 101 136 124 125 FINANCIAL STATISTICS
TotCompIncLoss 120 118 142 128 128 Mar 25 Sep 24 Sep 23 Sep 22 Sep 21
Fixed Ass 861 881 844 658 607 (EUR ’000) Interim Final Final Final Final
Inv & Loans 957 1 024 1 064 1 125 1 178 NetRent/InvInc 20 323 48 016 48 249 47 444 45 835
Tot Curr Ass 1 373 1 283 1 319 1 240 979 Total Inc 20 778 77 720 53 570 58 435 52 885
Ord SH Int 1 920 1 856 1 782 1 679 1 578 Attrib Inc 1 033 1 968 - 181 052 60 352 91 360
Minority Int 1 - - - - 1 TotCompIncLoss 1 033 1 968 - 180 992 60 387 91 373
LT Liab 343 1 052 1 106 783 949 Ord UntHs Int 356 302 318 367 316 400 514 300 467 975
Tot Curr Liab 1 281 649 729 871 637 FixedAss/Prop 825 593 860 964 989 014 1 030 959 944 020
PER SHARE STATISTICS (cents per share) Tot Curr Ass 22 961 58 285 33 861 126 131 78 850
HEPS-C (ZARc) 24.98 22.54 29.33 31.41 22.41 Total Ass 901 422 945 382 1 030 179 1 181 815 1 093 303
DPS (ZARc) 11.00 10.00 10.00 9.00 11.00 Tot Curr Liab 255 356 260 665 183 899 110 088 59 652
NAV PS (ZARc) 435.00 424.00 406.00 385.00 363.00 PER SHARE STATISTICS (cents per share)
3 Yr Beta - 0.09 - 0.45 - 0.03 0.43 0.66 HEPLU-C (ZARc) 77.12 2 029.09 - 3 730.56 1 472.32 1 666.62
Price High 260 265 270 245 200 DPLU (ZARc) - - - 247.62 666.42
Price Low 200 167 187 125 70 NAV (ZARc) 18 300.27 19 631.37 19 829.70 25 878.88 23 255.02
Price Prd End 219 229 217 198 140 3 Yr Beta 2.58 2.39 - - -
RATIOS Price Prd End 15 600 15 600 12 000 2 428 1 605
Ret on SH Fnd 6.11 5.43 7.59 7.41 7.87 Price High 15 600 15 600 12 000 2 428 29 300
Oper Pft Mgn 7.15 7.12 8.55 8.33 8.14 Price Low 15 600 12 000 2 428 1 605 1 605
D:E 0.54 0.63 0.70 0.61 0.70 RATIOS
Current Ratio 1.07 1.98 1.81 1.42 1.54 RetOnSH Funds 0.58 0.62 - 57.22 11.73 19.52
Div Cover 2.44 2.31 3.10 3.17 2.60 RetOnTotAss 4.61 8.22 5.20 4.94 4.84
Debt:Equity 1.27 1.63 2.05 1.26 1.32
OperRetOnInv 4.92 5.58 4.88 4.60 4.86
OpInc:Turnover 57.35 62.01 60.52 63.78 65.79
104