
Page 92 - shbh24_complete
P. 92
JSE – CAF Profile’s Stock Exchange Handbook: 2024 – Issue 3
FINANCIAL STATISTICS
SCOM 40 Week MA BYTES
(ZWD million) Mar 24 Sep 23 Sep 22 Sep 21 Sep 20
16000 Interim Final Final Final Final
Turnover 212 867 109 635 12 218 3 377 861
13442
Op Inc 112 595 61 380 5 686 1 120 422
NetIntPd(Rcvd) 3 488 1 656 776 84 13
10883
Att Inc 78 656 50 876 3 851 762 318
8325 TotCompIncLoss 78 656 50 876 3 851 762 318
Fixed Ass 1 956 504 33 3 4
5767
Tot Curr Ass 187 847 66 411 7 971 1 546 641
Ord SH Int 119 573 40 935 4 284 1 204 395
3208
| 2021 | 2022 | 2023 | 2024
Tot Curr Liab 72 387 27 033 3 875 389 254
FINANCIAL STATISTICS PER SHARE STATISTICS (cents per share)
(Amts in GBP’000) Feb 24 Feb 23 Feb 22 Feb 21 HEPS-C (ZARc) 13 771.68 3 005.76 1 144.90 91.07 38.17
Final Final Final(rst) Final DPS (ZARc) - 147.06 123.18 - -
Turnover 207 021 184 421 145 836 393 569 NAV PS (ZARc) 14 516.10 2 422.95 382.67 144.22 47.47
Op Inc 56 712 50 883 42 155 26 844 3 Yr Beta 0.76 0.12 0.07 0.06 0.62
NetIntPd(Rcvd) - 4 718 491 589 181 Price High 200 130 125 100 100
Att Inc 46 851 40 421 32 854 19 933 Price Low 130 125 100 100 100
Fixed Ass 8 478 8 380 8 049 8 275 Price Prd End 200 130 125 100 100
Tot Curr Ass 322 467 269 681 231 634 135 168 RATIOS
Ord SH Int 78 336 61 497 47 567 16 748 Ret on SH Fnd 131.56 124.29 89.89 63.33 80.46
LT Liab 3 451 3 528 3 676 5 238 Oper Pft Mgn 52.89 55.99 46.53 33.16 48.97
Tot Curr Liab 297 931 255 742 232 325 167 568
D:E 0.13 0.10 0.39 0.11 0.23
PER SHARE STATISTICS (cents per share) Current Ratio 2.60 2.46 2.06 3.98 2.52
HEPS-C (ZARc) 457.27 341.61 279.34 182.16 Div Cover - 20.48 9.31 - -
DPS (ZARc) 406.19 348.14 247.58 -
NAV PS (ZARc) 790.31 570.20 410.31 150.72
3 Yr Beta 0.71 - - -
Price High 16 200 10 000 13 000 9 226
Price Low 7 885 7 350 7 962 5 635
Price Prd End 13 674 8 859 9 388 8 269
RATIOS
Ret on SH Fnd 59.81 65.73 69.07 119.02
Oper Pft Mgn 27.39 27.59 28.91 6.82
D:E 0.04 0.06 0.08 0.31
Current Ratio 1.08 1.05 1.00 0.81
Div Cover 1.13 0.98 1.13 -
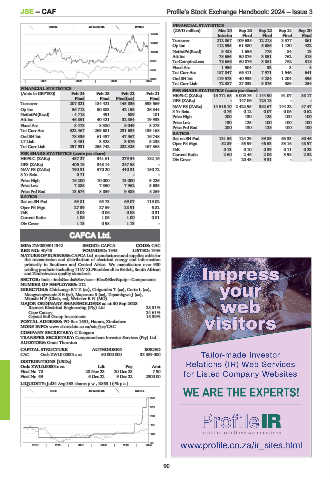
CAFCA Ltd.
CAF
ISIN: ZW0009011942 SHORT: CAFCA CODE: CAC
REG NO: 40/45 FOUNDED: 1945 LISTED: 1946
NATURE OF BUSINESS: CAFCA Ltd. manufactures and supplies cable for
the transmission and distribution of electrical energy and information
primarily in Southern and Central Africa. We manufacture over 900
cabling products including 11kV XLPE cables all to British, South African
and Zimbabwean quality standards.
SECTOR: Inds—IndsGoods&Services—Elec&ElecEquip—Components
NUMBER OF EMPLOYEES: 212
DIRECTORS: ChidzongaETZ(ne), Chigumbu T (ne), Corte L (ne),
MangwengwendeSE(ne), Maparura S (ne), Tapambgwa J (ne),
Mkushi H P (Chair, ne), Webster R N (MD)
MAJOR ORDINARY SHAREHOLDERS as at 30 Sep 2023
Reunert Electrical Engineering (Pty) Ltd. 28.31%
Cape Canary 24.61%
Crystal Ball Group Investment 15.39%
POSTAL ADDRESS: PO Box 1651, Harare, Zimbabwe
MORE INFO: www.sharedata.co.za/sdo/jse/CAC
COMPANY SECRETARY: C Kangara
TRANSFER SECRETARY: Computershare Investor Services (Pty) Ltd.
AUDITORS: Grant Thornton
CAPITAL STRUCTURE AUTHORISED ISSUED
CAC Ords ZWL0.00001c ea 50 000 000 33 389 000
DISTRIBUTIONS [USDc]
Ords ZWL0.00001c ea Ldt Pay Amt
Final No 70 28 Nov 23 20 Dec 23 7.90
Final No 69 6 Dec 22 9 Dec 22 2300.00
LIQUIDITY: Jul24 Avg 333 shares p.w., R863.1(-% p.a.)
ELEE 40 Week MA CAFCA
378
316
253
191
128
66
2019 | 2020 | 2021 | 2022 | 2023 | 2024
90