
Page 94 - shbh24_complete
P. 94
JSE – CAP Profile’s Stock Exchange Handbook: 2024 – Issue 3
Capital & Regional plc Capitec Bank Holdings Ltd.
CAP CAP
ISIN: GB00BL6XZ716 SHORT: CAPREG CODE: CRP ISIN: ZAE000035861 SHORT: CAPITEC CODE: CPI
REG NO: 01399411 FOUNDED: 1978 LISTED: 2015 ISIN: ZAE000083838 SHORT: CAPITEC-P CODE: CPIP
NATURE OF BUSINESS: Capital & Regional is a UK focused retail REG NO: 1999/025903/06 FOUNDED: 1999 LISTED: 2002
property REIT specialising in shopping centres that dominate their NATURE OF BUSINESS: Capitec Bank Holdings Ltd. (Capitec or the
catchment, servingthe non-discretionaryandvalueorientatedneedsofthe group) is listed on the Johannesburg Stock Exchange Ltd. (JSE). It owns
local communities. It has a strong track record of delivering value the operating subsidiaries Capitec Bank Ltd. (Capitec Bank or the bank),
enhancing retail and leisure asset management opportunities across a Capitec Ins (Pty) Ltd. (Capitec Ins) and Capitec Life Ltd. (Capitec Life).
portfolio of in-town shopping centres. Capital & Regional is listed on the SECTOR: Fins—Banks—Banks—Banks
main market of the London Stock Exchange (LSE) and has a secondary NUMBER OF EMPLOYEES: 15 747
listing on the Johannesburg Stock Exchange (JSE). DIRECTORS: Bhettay N (ind ne), du PlessisSA(ind ne),
SECTOR: RealEstate—RealEstate—REITS—Retail du Pré le RouxMS(ne), Fernandez C (ind ne), Ford-Hoon N (ind ne),
NUMBER OF EMPLOYEES: 274 Mahlangu V (ld ind ne), Makwane K (ind ne), MoutonPJ(ne),
DIRECTORS: Muchanya G (ne), Murphy G (ne), Sasse L N (ne), OttoCA(ind ne), Botha S L (Chair, ind ne), Fourie G M (CEO),
Theocharides P (ne), Wadey K (ne), Hunter D (Chair, ne), Hutchings L (CE), Hardy G (CFO)
Wetherly S (Group FD), Norval L (ind ne), Whyte L (ind ne) MAJOR ORDINARY SHAREHOLDERS as at 26 Jun 2024
MAJOR ORDINARY SHAREHOLDERS as at 08 Feb 2024 PSG Financial Services Ltd. 30.69%
Growthpoint Properties Ltd. 68.13% Public Investment Corporation SOC Ltd. 15.03%
MStead Ltd. 4.73% Lebashe Investment Group (Pty) Ltd. 7.27%
Black Crane Capital 4.17% POSTAL ADDRESS: PO Box 12451, Die Boord, Stellenbosch, 7613
MORE INFO: www.sharedata.co.za/sdo/jse/CRP MORE INFO: www.sharedata.co.za/sdo/jse/CPI
COMPANY SECRETARY: Stuart Wetherly COMPANY SECRETARY: Yolandé Mouton
TRANSFER SECRETARY: JSE Investor Services (Pty) Ltd. TRANSFER SECRETARY: Computershare Investor Services (Pty) Ltd.
SPONSOR: Java Capital (Pty) Ltd. SPONSOR: PSG Capital (Pty) Ltd.
AUDITORS: Mazars LLP AUDITORS: Deloitte & Touche Inc., PwC Inc.
CAPITAL STRUCTURE AUTHORISED ISSUED CAPITAL STRUCTURE AUTHORISED ISSUED
CRP Ords of GBP10p ea - 232 996 247 CPI Ords 1c ea 500 000 000 116 099 843
DISTRIBUTIONS [GBPp] DISTRIBUTIONS [ZARc]
Ords of GBP10p ea Ldt Pay Amt Ords 1c ea Ldt Pay Amt
Final No 13 9 Apr 24 7 Jun 24 2.95 Final No 39 14 May 24 20 May 24 3345.00
Interim No 12 29 Aug 23 22 Sep 23 2.75 Interim No 38 17 Oct 23 23 Oct 23 1530.00
LIQUIDITY: Jul24 Avg 22 528 shares p.w., R295 670.3(0.5% p.a.) LIQUIDITY: Jul24 Avg 1m shares p.w., R2 944.1m(64.6% p.a.)
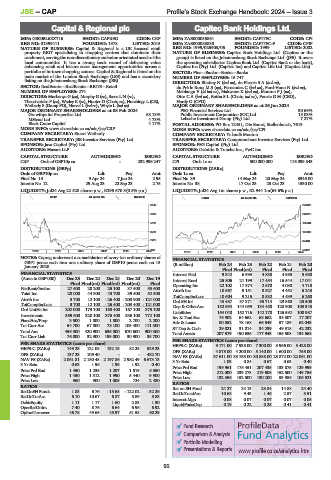
REIV 40 Week MA CAPREG BANK 40 Week MA CAPITEC
8142 273225
6662 229279
5181 185334
3701 141388
2220 97443
740 53497
2019 | 2020 | 2021 | 2022 | 2023 | 2024 2019 | 2020 | 2021 | 2022 | 2023 | 2024
NOTES: Capreg underwent a consolidation of every ten ordinary shares of FINANCIAL STATISTICS
GBP1 pence each into one ordinary share of GBP10 pence each on 15
January 2020. (R million) Feb 24 Feb 23 Feb 22 Feb 21 Feb 20
Final Final(rst) Final Final Final
FINANCIAL STATISTICS Interest Paid 9 342 6 993 4 838 4 985 5 680
(Amts in GBP’000) Dec 23 Dec 22 Dec 21 Dec 20 Dec 19 Interest Rcvd 25 806 21 199 17 454 16 544 17 041
Final Final(rst) Final(rst) Final(rst) Final Operating Inc 22 102 17 874 2 570 4 030 4 710
NetRent/InvInc 27 600 28 200 25 100 37 500 53 600 Attrib Inc 10 567 9 151 8 527 4 452 6 243
Total Inc 28 000 44 900 43 700 39 500 52 500
TotCompIncLoss 10 604 9 215 8 532 4 439 6 260
Attrib Inc 3 700 12 100 - 26 400 - 203 900 - 121 000 Ord SH Int 43 487 37 871 35 714 29 860 25 508
TotCompIncLoss 3 700 12 100 - 26 400 - 203 400 - 121 000 Dep & OtherAcc 152 994 144 059 134 458 120 908 103 343
Ord UntHs Int 202 000 179 100 168 400 167 100 375 100 Liabilities 164 048 152 716 142 178 126 592 108 987
Investments 369 600 320 100 376 400 536 100 772 100 Inv & Trad Sec 75 902 64 662 63 662 35 307 17 207
FixedAss/Prop 3 500 1 800 1 800 2 700 2 200 Adv & Loans 80 552 78 168 66 549 57 189 62 043
Tot Curr Ass 54 700 67 800 78 100 105 400 111 300 ST Dep & Cash 29 021 31 014 34 239 49 318 42 232
Total Ass 459 300 420 900 636 000 670 600 900 300 Total Assets 207 579 190 636 177 943 156 508 134 568
Tot Curr Liab 76 000 32 900 199 000 30 900 35 700
PER SHARE STATISTICS (cents per share)
PER SHARE STATISTICS (cents per share) HEPS-C (ZARc) 9 171.00 7 938.00 7 300.00 3 966.00 5 428.00
HEPS-C (ZARc) 149.25 121.08 132.15 82.25 529.23 DPS (ZARc) 4 875.00 4 200.00 5 140.00 1 600.00 755.00
DPS (ZARc) 137.23 109.40 - - 432.70 NAV PS (ZARc) 37 611.00 33 753.00 30 888.00 25 872.00 22 061.00
NAV PS (ZARc) 2 061.81 2 180.48 2 197.86 2 982.49 6 673.13 3 Yr Beta 1.03 0.84 0.67 0.63 0.40
3 Yr Beta 0.63 1.96 1.99 1.92 0.40 Price Prd End 199 961 175 451 207 435 133 875 129 999
Price Prd End 1 450 1 235 1 207 1 519 5 350 Price High 212 000 239 273 219 608 152 500 149 756
Price High 1 450 1 312 1 990 5 440 9 900 Price Low 132 856 152 500 130 200 53 986 106 521
Price Low 960 900 1 005 724 2 480 RATIOS
RATIOS Ret on SH Fund 24.27 24.13 23.84 14.88 24.40
RetOnSH Funds 1.83 6.76 - 15.68 - 122.02 - 32.26 RetOnTotalAss 10.68 9.43 1.46 2.57 3.51
RetOnTotAss 6.10 10.67 6.87 5.89 5.83 Interest Mgn 0.08 0.07 0.07 0.07 0.08
Debt:Equity 1.11 1.17 1.60 2.83 1.30 LiquidFnds:Dep 0.19 0.22 0.25 0.41 0.41
OperRetOnInv 7.40 8.76 6.64 6.96 6.92
OpInc:Turnover 46.78 49.65 45.97 51.58 60.29
Fund Research
Comparison & Analysis
Portfolio Modelling
Presentations & Reports www.profile.co.za/analytics.htm
92