
Page 153 - shbh24_complete
P. 153
Profile’s Stock Exchange Handbook: 2024 – Issue 3 JSE – NEP
NEPI Rockcastle NV Netcare Ltd.
NEP NET
ISIN: NL0015000RT3 SHORT: NEPIROCK CODE: NRP ISIN: ZAE000011953 SHORT: NETCARE CODE: NTC
REG NO: 014178V FOUNDED: 2016 LISTED: 2017 ISIN: ZAE000081121 SHORT: NTC PREF CODE: NTCP
NATURE OF BUSINESS: NEPI Rockcastle is the premier owner and REG NO: 1996/008242/06 FOUNDED: 1996 LISTED: 1996
operator of shopping centres in Central and Eastern Europe (CEE), with NATURE OF BUSINESS: The Netcare Group is a leading provider of private
presenceinninecountriesandaninvestmentportfolioofEUR6.8billionas healthcare services in South Africa. It provides acute services across its
at 30 June 2023. The Group benefits from a highly-skilled internal national network of hospitals and are the market leader in mental health
management team which combines asset management, development, services. Netcare provides emergency, cancer care, diagnostic support,
investment, leasing and financial expertise. primary care, and renal care services as well as occupational health and
SECTOR: RealEstate—RealEstate—InvestmentServices—Holdings wellness services. The Group improves access to affordable high-quality
NUMBER OF EMPLOYEES: 601 healthcare services through NetcarePlus. Netcare Education develops
DIRECTORS: Brown S (ne), de Lange A (ind ne), DijkstraALV healthcare professionals in nursing and emergency medical services.
(ind ne, Neth), Holscher J (ind ne), Klingen A (ld ind ne), Lurie J (ind ne), SECTOR: HlthCare—HtlhCare—HlthCarePrvdrs—HlthCareFacilities
MajijaSV(alt), MihaescuAM(ind ne), OlivierAK(alt), NUMBER OF EMPLOYEES: 18 568
van der Veer A (ind ne), Aase G (Chair, ind ne), Dany R (CEO), DIRECTORS: BowerMR(ind ne), Bulo B (ind ne), Human L (ind ne),
Noetzel M P (COO, Pol), Predoiu E (CFO) KirkIM(ind ne, Ire), MaditsiAK(ind ne), Phillips Dr R (ind ne),
MAJOR ORDINARY SHAREHOLDERS as at 04 Mar 2024 Stephens L (ind ne), Friedland Dr R H (CEO), Gibson K N (Group CFO)
Fortress Real Estate Investments Ltd. 23.72% MAJOR ORDINARY SHAREHOLDERS as at 19 Jul 2024
Public Investment Corporation 16.69% Public Investment Corporation Ltd. 26.84%
State Street Bank and Trust 6.40% Capital Research Global Investors 5.64%
POSTAL ADDRESS: WTC Zuidas, Tower 10, 5th Floor, Fairtree Asset Management (Pty) Ltd. 5.00%
Strawinskylaan 563, Amsterdam, 1077XX POSTAL ADDRESS: Private Bag X34, Benmore, 2010
MORE INFO: www.sharedata.co.za/sdo/jse/NRP MORE INFO: www.sharedata.co.za/sdo/jse/NTC
COMPANY SECRETARY: Alex Florescu COMPANY SECRETARY: Charles Vikisi
TRANSFER SECRETARY: Computershare Investor Services (Pty) Ltd. TRANSFER SECRETARY: CTSE Registry Services (Pty) Ltd.
SPONSOR: Java Capital (Pty) Ltd. SPONSOR: Nedbank Corporate and Investment Banking
AUDITORS: Ernst & Young Inc. AUDITORS: Deloitte & Touche Inc.
CAPITAL STRUCTURE AUTHORISED ISSUED CAPITAL STRUCTURE AUTHORISED ISSUED
NRP Ords EUR1c ea 2 000 000 000 660 826 020 NTC Ords 1c ea 2 500 000 000 1 417 549 301
DISTRIBUTIONS [EURc] DISTRIBUTIONS [ZARc]
Ords EUR1c ea Ldt Pay Amt Scr/100 Ords 1c ea Ldt Pay Amt
Final No 13 12 Mar 24 12 Apr 24 25.61 - Interim No 27 9 Jul 24 15 Jul 24 30.00
Interim No 12 12 Sep 23 6 Oct 23 25.67 5.29 Final No 26 23 Jan 24 29 Jan 24 35.00
LIQUIDITY: Jul24 Avg 8m shares p.w., R1 029.4m(66.7% p.a.) LIQUIDITY: Jul24 Avg 26m shares p.w., R334.3m(95.9% p.a.)
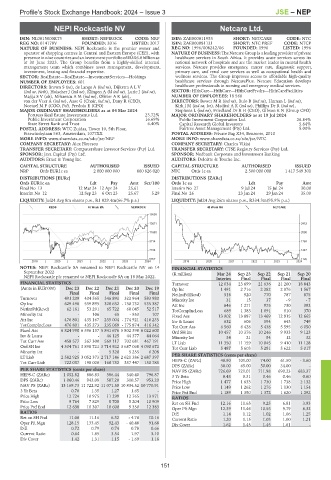
REDS 40 Week MA NEPIROCK 40 Week MA NETCARE
15650
13671 2412
11693 2090
9714 1769
7736 1447
5757 1126
2019 | 2020 | 2021 | 2022 | 2023 | 2024 2019 | 2020 | 2021 | 2022 | 2023 | 2024
NOTES: NEPI Rockcastle SA renamed to NEPI Rockcastle NV on 14 FINANCIAL STATISTICS
September 2022 (R million) Mar 24 Sep 23 Sep 22 Sep 21 Sep 20
NEPI Rockcastle plc renamed to NEPI Rockcastle SA on 18 May 2022.
Interim Final Final Final Final
FINANCIAL STATISTICS Turnover 12 034 23 699 21 636 21 200 18 843
(Amts in EUR’000) Dec 23 Dec 22 Dec 21 Dec 20 Dec 19 Op Inc 1 491 2 716 2 282 2 076 1 567
Final Final Final Final Final NetIntPd(Rcvd) 516 920 770 787 875
Turnover 491 209 404 565 346 891 322 964 583 980 Minority Int 31 15 37 - 9 - 7
Op Inc 629 496 539 895 320 632 - 130 732 535 387 Att Inc 646 1 271 975 730 392
NetIntPd(Rcvd) 62 161 53 291 65 722 60 045 52 517 TotCompIncLoss 689 1 383 1 091 810 370
Minority Int - 106 65 - 953 107 Fixed Ass 13 902 13 887 13 469 12 915 12 665
Att Inc 476 801 435 167 235 004 - 174 921 416 235 Inv & Loans 632 606 594 643 749
TotCompIncLoss 476 801 435 273 235 069 - 175 874 416 342 Tot Curr Ass 6 560 6 428 5 438 5 595 6 050
Fixed Ass 6 824 990 6 596 137 5 841 676 5 802 398 6 022 600 Ord SH Int 10 457 10 376 10 246 9 933 9 123
Inv & Loans - - 46 125 44 377 44 064 Minority Int 34 21 54 12 32
Tot Curr Ass 458 577 367 300 569 117 702 681 467 191 LT Liab 11 350 11 159 10 045 9 410 11 128
Ord SH Int 4 304 761 3 898 721 3 714 922 3 687 068 4 090 672 Tot Curr Liab 5 487 5 603 5 281 5 622 5 017
Minority Int - - 5 320 5 255 6 208
LT Liab 2 582 925 3 052 373 2 717 146 2 621 386 2 687 397 PER SHARE STATISTICS (cents per share)
Tot Curr Liab 722 037 198 028 160 752 357 447 150 785 HEPS-C (ZARc) 48.90 101.00 74.00 61.50 - 3.60
DPS (ZARc) 30.00 65.00 50.00 34.00 -
PER SHARE STATISTICS (cents per share)
NAV PS (ZARc) 726.69 721.01 711.98 690.23 683.37
HEPS-C (ZARc) 1 052.82 886.83 586.44 340.40 796.87 3 Yr Beta 0.43 0.31 0.46 0.46 0.60
DPS (ZARc) 1 060.46 943.09 587.20 310.57 953.20 Price High 1 477 1 633 1 730 1 738 2 132
NAV PS (ZARc) 13 169.73 11 722.92 11 071.50 10 834.52 10 770.91 Price Low 1 149 1 262 1 276 1 130 1 154
3 Yr Beta 0.70 1.35 1.27 1.65 - Price Prd End 1 189 1 350 1 372 1 620 1 292
Price High 12 724 10 975 11 299 12 765 13 971 RATIOS
Price Low 9 764 7 829 8 700 5 204 10 909 Ret on SH Fnd 12.16 11.65 9.25 6.81 3.93
Price Prd End 12 638 10 307 10 600 9 350 12 383 Oper Pft Mgn 12.39 11.46 10.55 9.79 8.32
RATIOS D:E 1.14 1.12 1.02 1.06 1.25
Ret on SH Fnd 11.08 11.16 6.32 - 4.76 10.16 Current Ratio 1.20 1.15 1.03 1.00 1.21
Oper Pft Mgn 128.15 133.45 92.43 - 40.48 91.68 Div Cover 1.62 1.45 1.45 1.61 -
D:E 0.72 0.79 0.74 0.78 0.66
Current Ratio 0.64 1.85 3.54 1.97 3.10
Div Cover 1.42 1.31 1.15 - 1.69 1.16
151