
Page 152 - shbh24_complete
P. 152
JSE – NAS Profile’s Stock Exchange Handbook: 2024 – Issue 3
Naspers Ltd. Nedbank Group Ltd.
NAS NED
ISIN: ZAE000325783 SHORT: NASPERS-N CODE: NPN ISIN: ZAE000004875 SHORT: NEDBANK
REG NO: 1925/001431/06 FOUNDED: 1925 LISTED: 1994 CODE: NED REG NO: 1966/010630/06
NATURE OF BUSINESS: Established in 1915, Naspers has transformed FOUNDED: 1888 LISTED: 1969
itself to become a global consumer internet company and one of the largest NATURE OF BUSINESS: Nedbank Group, with
technology investorsinthe world.Through Prosus,the group operatesand assets of more than R1.3tn, is one of the largest
invests globally in markets with long-term growth potential, building financial services groups in Africa, offering
leading consumer internet companies that empower people and enrich wholesale and retail banking, as well as
communities. Prosus has its primary listing on Euronext Amsterdam and a insurance, asset management and wealth
management services and solutions to more
secondary listing on the Johannesburg Stock Exchange and Naspers is the than 7.3 million active clients. The group’s
majority owner of Prosus. ordinary shares have been listed on the JSE since
SECTOR:Technology—Technology—Software&CompSer—DigitalService 1969. In South Africa (SA), Nedbank has a strong franchise that
NUMBER OF EMPLOYEES: 25 564 contributes 90% of the group’s R1.3tn in assets and 80% of the group’s
DIRECTORS: Dubey S (ind ne), Kemna A (ind ne), Bloisi F (CEO), R15.7bn headline earnings (HE).
Bekker J P (Chair, ne), Sgourdos B (CFO), du ToitHJ(ld ind ne), SECTOR: Fins—Banks—Banks—Banks
Enenstein C (ind ne), Girotra M (ind ne, Indian), Jafta ProfRCC(ind ne), NUMBER OF EMPLOYEES: 25 477 (permanent)
LeteleFLN(ind ne), Meyer Prof D (ind ne), Oliveira de Lima R (ind ne), DIRECTORS: Nombembe T (ind ne), BrodyHR(ld ind ne),
DamesBA(ind ne), Davis M (CFO), DongwanaNP(ind ne),
PacakSJZ(ne), SorourMR(ne), StofbergJDT (Alternate, ind ne), Xu KrugerEM(ind ne), Langeni P (ind ne), LeithRAG(ne),
Y(ind ne, China) Makalima L (ind ne), Mminele A D (Chair, ind ne), Nkuhlu M C (COO),
MAJOR ORDINARY SHAREHOLDERS as at 31 Mar 2024 Quinn J P (CE), Subramoney S (ind ne)
Public Investment Corporation Group 15.83% MAJOR ORDINARY SHAREHOLDERS as at 31 Dec 2023
POSTAL ADDRESS: PO Box 2271, Cape Town, 8000 Government Employees Pension Fund 15.37%
MORE INFO: www.sharedata.co.za/sdo/jse/NPN Allan Gray Ltd (SA) 6.88%
COMPANY SECRETARY: Lynelle Bagwandeen POSTAL ADDRESS: PO Box 1144, Johannesburg, 2000
TRANSFER SECRETARY: JSE Investor Services (Pty) Ltd. EMAIL: NedGroupIR@Nedbank.co.za
SPONSOR: Investec Bank Ltd. WEBSITE: www.nedbankgroup.co.za
TELEPHONE: 011-294-4444
AUDITORS: Deloitte & Touche Inc. COMPANY SECRETARY: Jackie Katzin
CAPITAL STRUCTURE AUTHORISED ISSUED TRANSFER SECRETARY: JSE Investor Services (Pty) Ltd.
NPN N Ords 2c ea 500 000 000 178 284 116 SPONSORS:MerrillLynchSA(Pty)Ltd.t/aBofASecurities, NedbankCIB
AUDITORS: Deloitte & Touche, Ernst & Young Inc.
DISTRIBUTIONS [ZARc]
N Ords 2c ea Ldt Pay Amt CAPITAL STRUCTURE AUTHORISED ISSUED
Final No 94 5 Dec 23 11 Dec 23 874.00 NED Ords 100c ea 600 000 000 488 020 500
Final No 93 4 Oct 22 10 Oct 22 660.23 DISTRIBUTIONS [ZARc]
LIQUIDITY: Jul24 Avg 3m shares p.w., R8 390.1m(73.1% p.a.) Ords 100c ea Ldt Pay Amt
Final No 62 9 Apr 24 15 Apr 24 1022.00
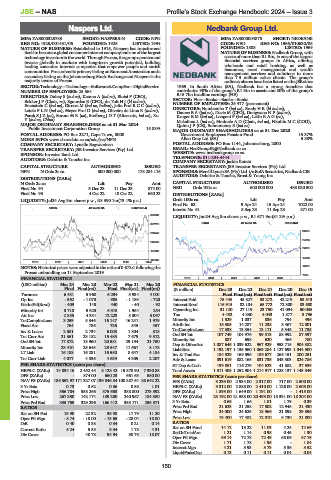
SCOM 40 Week MA NASPERS-N
Interim No 61 5 Sep 23 11 Sep 23 871.00
390800 LIQUIDITY: Jun24 Avg 8m shares p.w., R1 671.9m(81.2% p.a.)
337120 BANK 40 Week MA NEDBANK
32831
283440
27856
229760
22881
176080
17906
122399
2019 | 2020 | 2021 | 2022 | 2023 | 2024
12931
NOTES: Historical prices were adjusted in the ratio of 0.672:1 following the
Prosus unbundling on 11 September 2019.
7956
2019 | 2020 | 2021 | 2022 | 2023 |
FINANCIAL STATISTICS
(USD million) Mar 24 Mar 23 Mar 22 Mar 21 Mar 20 FINANCIAL STATISTICS
Final Final(rst) Final Final(rst) Final(rst) (R million) Dec 23 Dec 22 Dec 21 Dec 20 Dec 19
Turnover 6 431 5 960 6 294 5 934 4 001 Final Final(rst) Final(rst) Final(rst) Final(rst)
Op Inc - 562 - 1 073 - 985 - 1 189 - 720 Interest Paid 75 445 45 827 33 272 42 219 53 513
NetIntPd(Rcvd) - 409 143 440 - 40 - 92 Interest Rcvd 116 915 82 104 65 772 72 300 83 680
Minority Int 3 710 5 623 6 315 1 964 254 Operating Inc 31 120 27 119 23 750 41 094 50 035
Att Inc 2 855 4 331 12 223 5 304 3 097 Tax 4 432 4 330 4 043 1 877 3 796
TotCompIncLoss 3 259 5 346 16 147 16 241 1 979 Minority Int 1 529 1 037 836 794 496
Fixed Ass 764 786 736 545 457 Attrib Inc 15 305 14 287 11 238 3 467 12 001
13 171
5 345
11 735
17 338
TotCompIncLoss
13 354
Inv & Loans 2 581 2 734 6 008 1 804 818
Tot Curr Ass 21 361 23 182 15 485 7 679 9 512 Ord SH Int 107 749 104 976 99 513 88 992 87 597
620
Minority Int
887
698
780
466
Ord SH Int 17 872 18 960 20 581 29 194 21 750 Dep & OtherAcc 1 087 645 1 039 622 967 929 953 715 904 382
Minority Int 23 410 25 645 29 547 11 667 8 178 Liabilities 1 192 197 1 136 960 1 069 284 1 127 693 1 044 900
LT Liab 16 188 16 281 16 550 8 647 4 184 Inv & Trad Sec 184 529 169 596 189 677 265 151 200 251
Tot Curr Liab 4 077 4 336 4 639 4 309 2 207 Adv & Loans 891 619 882 165 831 735 843 303 824 786
PER SHARE STATISTICS (cents per share) ST Dep & Cash 139 851 116 279 104 623 41 382 37 635
HEPS-C (ZARc) 14 834.16 2 452.45 8 128.42 15 878.90 7 330.88 Total Assets 1 311 408 1 252 904 1 214 917 1 228 137 1 143 349
DPS (ZARc) - 874.00 660.23 661.63 580.00 PER SHARE STATISTICS (cents per share)
NAV PS (ZARc) 186 552.97 171 327.07 139 846.84 100 887.64 88 642.22 EPS (ZARc) 3 239.00 2 934.00 2 317.00 717.00 2 500.00
3 Yr Beta 0.73 0.52 0.36 0.58 1.01 HEPS-C (ZARc) 3 312.00 2 888.00 2 410.00 1 126.00 2 605.00
Price High 356 784 358 266 375 653 388 800 273 592 DPS (ZARc) 1 893.00 1 649.00 1 191.00 - 1 415.00
Price Low 267 330 142 174 139 250 240 967 184 380 NAV PS (ZARc) 23 192.00 21 533.00 20 493.00 18 391.00 18 204.00
Price Prd End 335 755 329 296 166 412 353 171 255 371 3 Yr Beta 0.69 1.66 1.81 1.79 0.39
RATIOS Price Prd End 21 623 21 258 17 502 12 948 21 430
Ret on SH Fnd 15.90 22.32 36.98 17.79 11.20 Price High 24 000 24 625 18 966 21 898 29 396
Oper Pft Mgn - 8.74 - 18.00 - 15.65 - 20.04 - 18.00 Price Low 19 400 17 482 12 010 6 730 21 000
RATIOS
D:E 0.40 0.38 0.34 0.21 0.14
Current Ratio 5.24 5.35 3.34 1.78 4.31 Ret on SH Fund 14.12 13.22 11.03 4.24 12.69
1.30
RetOnTotalAss
0.98
1.14
1.21
0.45
Div Cover - 40.78 94.94 30.75 18.07
Oper Pft Mgn 69.14 72.78 72.49 68.06 87.75
Div Cover 1.71 1.78 1.95 - 1.84
Interest Mgn 4.21 3.93 3.73 3.36 3.52
LiquidFnds:Dep 0.13 0.11 0.11 0.04 0.04
150