
Page 116 - Profile's Stock Exchange Handbook - 2025 Issue 3
P. 116
JSE - FAI Profile’s Stock Exchange Handbook: 2025 - Issue 3
Fairvest Ltd. Famous Brands Ltd.
ISIN: ZAE000304788 SHORT: FTAPROPA CODE: FTA ISIN: ZAE000053328 SHORT: FAMBRANDS CODE: FBR
ISIN: ZAE000304796 SHORT: FTBPROPB CODE: FTB REG NO: 1969/004875/06 FOUNDED: 1969 LISTED: 1994
REG NO: 2007/032604/06 FOUNDED: 2007 LISTED: 2011 NATURE OF BUSINESS: Famous Brands Ltd. (“Famous Brands” or “the
NATURE OF BUSINESS: Fairvest is a REIT that owns a diversified Group”) was established in the 1960s by entrepreneurs passionate
portfolio of 128 properties. The portfolio consists of a large about creating memorable consumer experiences. Since then, the
number of quality assets with a wide range of retail, office and Group has become Africa’s largest restaurant franchisor. We are
industrial tenants located throughout South Africa which delivers known for our world-class brands, product innovation, and long,
sustainable and growing income through the various economic mutually beneficial relationships with franchise partners.
cycles. The Group’s strategic objective is to divest from office and SECTOR: ConsDisr--Travel&Leis--Travel&Leis--Resturants&Bars
industrial assets to move towards becoming a retail only focused NUMBER OF EMPLOYEES: 4 522
fund. DIRECTORS: Halamandaris N (ne), Maditse A K (ld ind ne), Mathe B
SECTOR: RealEstate--RealEstate--REITS--Diversified (ind ne), Mosololi T (ind ne), Mzimba W (ind ne), Petersen-Cook F
NUMBER OF EMPLOYEES: 45 (ind ne), Boulle C H (Chair, ind ne), Hele D P (CEO), Shiluvana N
DIRECTORS: Andrag L W (ind ne), Buya Adv M (ind ne), du Toit J (ind ne), (Group FD)
Duker N B (ind ne), Futwa F (ind ne), Mkhize N (ind ne), Nkuna K R (ind ne), MAJOR ORDINARY SHAREHOLDERS as at 28 Feb 2025
Wiese Adv J D (ind ne), Wilder D W (CEO), Kriel J (CFO) Camissa Asset Management (Pty) Ltd. 16.10%
MAJOR ORDINARY SHAREHOLDERS as at 8 May 2025 Public Investment Company SOC Ltd. 10.19%
Coronation Asset Management (Pty) Ltd. 47.40% 36One Asset Management (Pty) Ltd. 8.32%
Public Investment Corporation SOC Ltd. 21.39% POSTAL ADDRESS: PO Box 2884, Halfway House, 1685
Old Mutual Group 7.14% MORE INFO: www.sharedata.co.za/sdo/jse/FBR
POSTAL ADDRESS: PO Box 685, Melrose Arch, 2076 COMPANY SECRETARY: Celeste Appollis
MORE INFO: www.sharedata.co.za/sdo/jse/FTA TRANSFER SECRETARY: Computershare Investor Services (Pty) Ltd.
COMPANY SECRETARY: FluidRock Co Sec (Pty) Ltd. SPONSOR: Standard Bank
TRANSFER SECRETARY: JSE Investor Services (Pty) Ltd. AUDITORS: KPMG
SPONSOR: Java Capital Trustees and Sponsors (Pty) Ltd. CAPITAL STRUCTURE Authorised Issued
AUDITORS: Forvis Mazars FBR Ords 1c ea 200 000 000 100 202 284
CAPITAL STRUCTURE Authorised Issued
FTA A ord shares 1 000 000 000 62 718 658 DISTRIBUTIONS [ZARc]
FTB B ord shares 2 000 000 000 1 793 474 520 Ords 1c ea Ldt Pay Amt
Final No 52 8 Jul 25 14 Jul 25 195.00
DISTRIBUTIONS [ZARc] Interim No 51 17 Dec 24 23 Dec 24 150.00
A ord shares Ldt Pay Amt LIQUIDITY: Jul25 Avg 973 154 shares p.w., R58.0m(50.5% p.a.)
Interim No 30 24 Jun 25 30 Jun 25 69.66
Final No 29 20 Dec 24 30 Dec 24 70.52 FAMBRANDS 40 Week MA TRAV
11000
LIQUIDITY: Jul25 Avg 285 324 shares p.w., R4.9m(23.7% p.a.) 10000
9000
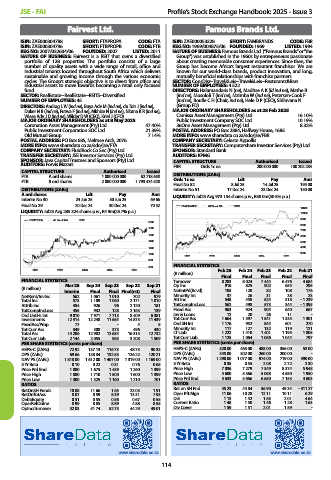
FTAPROPA 40 Week MA REIV
2000
8000
1800 7000
1600 6000
1400 5000
4000
1200
3000
1000 2021 2022 2023 2024 2025
800
FINANCIAL STATISTICS
600
2021 2022 2023 2024 2025 Feb 25 Feb 24 Feb 23 Feb 22 Feb 21
(R million) Final Final Final Final Final
FINANCIAL STATISTICS Turnover 8 283 8 024 7 444 6 476 4 684
Mar 25 Sep 24 Sep 23 Sep 22 Sep 21 Op Inc 916 825 902 655 295
(R million) Interim Final Final Final(rst) Final NetIntPd(Rcvd) 105 120 82 108 176
NetRent/InvInc 562 1 061 1 010 702 979 Minority Int 37 26 31 38 23
Total Inc 573 1 109 1 060 2 171 1 010 Att Inc 548 458 524 318 - 1 239
Attrib Inc 454 926 96 2 120 181 TotCompIncLoss 562 498 573 344 - 1 395
TotCompIncLoss 455 932 128 2 163 139 Fixed Ass 963 924 904 640 667
Ord UntHs Int 9 010 7 971 7 713 8 409 6 381 Inv & Loans 12 20 26 11 -
Investments 12 414 12 248 11 654 14 873 11 439 Tot Curr Ass 1 664 1 597 1 541 1 335 1 301
FixedAss/Prop 77 - - 4 5 Ord SH Int 1 176 952 844 601 270
Tot Curr Ass 349 308 373 496 430 Minority Int 117 127 132 119 121
Total Ass 14 206 12 902 12 634 16 315 12 732 LT Liab 1 222 1 410 1 401 1 195 1 805
Tot Curr Liab 2 144 2 055 965 3 208 1 509 Tot Curr Liab 1 125 1 064 1 056 1 044 797
PER SHARE STATISTICS (cents per share) PER SHARE STATISTICS (cents per share)
HEPS-C (ZARc) 72.92 137.13 116.73 48.73 90.33 HEPS-C (ZARc) 520.00 465.00 488.00 356.00 53.00
DPS (ZARc) 69.66 138.34 132.53 126.22 120.21 DPS (ZARc) 345.00 302.00 260.00 200.00 -
NAV PS (ZARc) 1 818.00 1 612.00 1 407.00 1 319.00 1 169.00 NAV PS (ZARc) 1 290.00 1 077.00 974.00 719.00 390.00
3 Yr Beta 0.10 0.22 0.31 0.76 0.65 3 Yr Beta 0.35 0.55 2.08 2.72 2.30
Price Prd End 1 800 1 675 1 439 1 260 1 399 Price High 7 036 7 279 7 349 8 374 5 948
Price High 1 880 1 710 1 500 1 600 1 399 Price Low 4 600 5 366 5 058 4 550 1 950
Price Low 1 300 1 325 1 160 1 210 701 Price Prd End 5 633 5 666 6 650 7 153 4 603
RATIOS RATIOS
RetOnSH Funds 10.08 11.66 1.65 23.03 1.91 Ret on SH Fnd 45.23 44.84 56.90 49.34 - 311.27
RetOnTotAss 8.07 8.59 8.39 13.31 7.93 Oper Pft Mgn 11.06 10.28 12.11 10.11 6.29
Debt:Equity 0.51 0.55 0.56 0.67 0.55 D:E 1.13 1.42 1.63 2.01 4.64
OperRetOnInv 8.99 8.85 8.89 4.88 8.55 Current Ratio 1.48 1.50 1.46 1.28 1.63
OpInc:Turnover 52.03 51.74 52.75 44.29 49.01 Div Cover 1.59 1.51 2.01 1.59 -
www.sharedata.co.za www.sharedata.co.za
114