
Page 191 - Profile's Stock Exchange Handbook - 2025 Issue 2
P. 191
Profile’s Stock Exchange Handbook: 2025 – Issue 2 JSE – SAP
Sappi Ltd. Sasol Ltd.
SAP SAS
ISIN: ZAE000006284 SHORT: SAPPI CODE: SAP ISIN: ZAE000006896 SHORT: SASOL CODE: SOL
REG NO: 1936/008963/06 FOUNDED: 1936 LISTED: 1937 ISIN: ZAE000151817 SHORT: BEE-SASOL CODE: SOLBE1
NATURE OF BUSINESS: Sappi is a leading global provider of everyday REG NO: 1979/003231/06 FOUNDED: 1950 LISTED: 1979
materials made from woodfibre-based renewable resources. As a NATURE OF BUSINESS: Sasol is a global energy and chemicals company.
diversified, innovative and trusted leader focused on sustainable processes Sasol harnesses its knowledge and expertise to integrate sophisticated
and products, Sappi is building a more circular economy by making what it technologies and processes into world-scale operating facilities. Sasol
should, not just what Sappi can. strives to safely and sustainably source, produce and market a range of
SECTOR: Basic Materials—Basic Resrcs—Ind Metals—Paper high-quality products globally, creating value for stakeholders.
NUMBER OF EMPLOYEES: 12 495 SECTOR: Basic Materials—Chemicals—Chemicals—Chemicals:Diversified
DIRECTORS: BeamishBR(ind ne), FallonMA(ld ind ne, UK), NUMBER OF EMPLOYEES: 29 073
Istavridis E (ind ne), Lopez J (ind ne), MalingaZN(ind ne), DIRECTORS: Cuambe M J (ind ne, Moz), Cumming T (ind ne), Eyton D G P
Mehlomakulu Dr B (ind ne), RendersRJAM(ind ne, Neth), (ind ne), Flöel M (snr ind ne, German), Harper K (ind ne, USA), Kahla V D,
StippJE(ind ne), von Zeuner L (ind ne), Sowazi N L (Chair, ind ne), Kennealy G M B (ind ne), Subramoney S (ne), Dube M B N (Chair, ld ind
Binnie S R (CEO), Pearce G T (CFO) ne), Baloyi S (CEO & President), Bruns W (CFO)
MAJOR ORDINARY SHAREHOLDERS as at 28 Mar 2025 MAJOR ORDINARY SHAREHOLDERS as at 30 Jun 2024
Public Investment Corporation Group 20.02% Government Employees Pension Fund 16.98%
Allan Gray (Pty) Ltd. 20.01% Industrial Development Corporation of SA Ltd. 8.21%
Ninety One SA (Pty) Ltd. 11.38% POSTAL ADDRESS: Private Bag X10014, Sandton, 2196
POSTAL ADDRESS: PO Box 52264, Saxonwold, 2132 MORE INFO: www.sharedata.co.za/sdo/jse/SOL
MORE INFO: www.sharedata.co.za/sdo/jse/SAP COMPANY SECRETARY: Helaine Joubert
COMPANY SECRETARY: Ami Mahendranath TRANSFER SECRETARY: JSE Investor Services (Pty) Ltd.
TRANSFER SECRETARY: Computershare Investor Services (Pty) Ltd. SPONSOR: Merrill Lynch SA (Pty) Ltd.
SPONSOR: UBS South Africa (Pty) Ltd. AUDITORS: KPMG Inc.
AUDITORS: KPMG Inc.
CAPITAL STRUCTURE AUTHORISED ISSUED
CAPITAL STRUCTURE AUTHORISED ISSUED SOL Ords no par value 1 127 690 590 643 043 757
SAP Ords 100c ea 725 000 000 604 641 463 SOLBE1 BEE ords no par value 158 331 335 6 331 347
DISTRIBUTIONS [USDc] DISTRIBUTIONS [ZARc]
Ords 100c ea Ldt Pay Amt Ords no par value Ldt Pay Amt
Final No 91 7 Jan 25 13 Jan 25 14.00 Interim No 83 12 Mar 24 18 Mar 24 200.00
Final No 90 9 Jan 24 15 Jan 24 15.00 Final No 82 12 Sep 23 18 Sep 23 1000.00
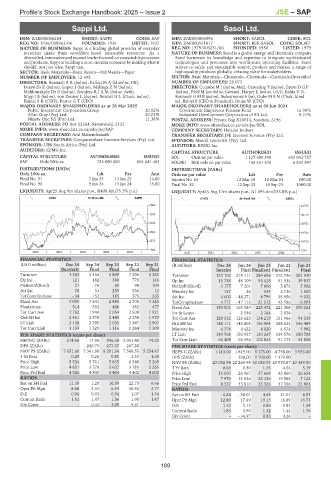
LIQUIDITY: Apr25 Avg 9m shares p.w., R408.4m(75.3% p.a.) LIQUIDITY: Apr25 Avg 17m shares p.w., R1 695.6m(133.8% p.a.)
IDMS 40 Week MA SAPPI CHES 40 Week MA SASOL
8592 42795
7262 34779
5932 26763
4602 18746
3273 10730
1943 2714
2020 | 2021 | 2022 | 2023 | 2024 | 2020 | 2021 | 2022 | 2023 | 2024 |
FINANCIAL STATISTICS FINANCIAL STATISTICS
(USD million) Dec 24 Sep 24 Sep 23 Sep 22 Sep 21 (R million) Dec 24 Jun 24 Jun 23 Jun 22 Jun 21
Quarterly Final Final Final Final Interim Final Final(rst) Final(rst) Final
Turnover 1 363 5 458 5 809 7 296 5 265 Turnover 122 102 275 111 289 696 272 746 201 910
Op Inc 121 182 380 770 146 Op Inc 15 738 48 109 55 418 51 514 39 837
NetIntPd(Rcvd) 21 76 59 98 104 NetIntPd(Rcvd) 3 175 7 201 7 006 5 876 5 902
Att Inc 70 33 259 536 13 Minority Int 157 26 534 2 716 1 500
TotCompIncLoss - 34 152 185 375 265 Att Inc 4 600 - 44 271 8 799 38 956 9 032
Fixed Ass 3 095 3 241 2 886 2 705 3 325 TotCompIncLoss 4 771 - 47 113 21 573 43 196 - 5 091
Plantations 514 562 488 382 477 Fixed Ass 170 501 163 589 225 472 221 308 198 021
Tot Curr Ass 1 762 1 948 2 054 2 508 1 921 Inv & Loans - 2 536 2 164 2 024 -
Ord SH Int 2 461 2 578 2 445 2 358 1 970 Tot Curr Ass 120 012 126 623 134 219 131 966 94 533
LT Liab 2 138 2 299 2 035 2 347 2 907 Ord SH Int 148 111 143 005 196 904 188 623 146 489
Tot Curr Liab 1 159 1 329 1 316 1 284 1 309 Minority Int 4 376 4 422 4 620 4 574 5 982
PER SHARE STATISTICS (cents per share) LT Liab 149 768 150 957 130 267 134 576 150 708
HEPS-C (ZARc) 214.56 17.98 946.50 2 051.40 74.25 Tot Curr Liab 65 409 66 596 102 045 91 773 53 858
DPS (ZARc) - 246.75 277.37 267.28 - PER SHARE STATISTICS (cents per share)
NAV PS (ZARc) 7 651.60 7 361.60 8 291.34 7 568.55 5 254.47 HEPS-C (ZARc) 1 413.00 1 819.00 5 375.00 4 758.00 3 953.00
3 Yr Beta 0.20 0.26 0.81 1.53 1.68 DPS (ZARc) - 200.00 1 700.00 1 470.00 -
Price High 5 526 5 761 5 835 6 348 5 269 NAV PS (ZARc) 23 032.94 22 269.94 31 040.95 29 970.87 23 449.50
Price Low 4 631 3 776 3 627 3 785 2 265 3 Yr Beta 0.66 0.30 1.35 4.54 5.19
Price Prd End 4 926 4 845 4 404 4 402 4 000 Price High 15 050 26 967 37 668 43 860 26 654
RATIOS Price Low 7 970 11 036 22 136 19 588 7 122
Ret on SH Fnd 11.38 1.28 10.59 22.73 0.66 Price Prd End 8 327 13 810 23 326 37 168 21 801
Oper Pft Mgn 8.88 3.33 6.54 10.55 2.77 RATIOS
D:E 0.94 0.93 0.94 1.07 1.54 Ret on SH Fnd 6.24 - 30.01 4.63 21.57 6.91
Current Ratio 1.52 1.47 1.56 1.95 1.47 Oper Pft Mgn 12.89 17.49 19.13 18.89 19.73
Div Cover - 0.44 3.09 5.61 - D:E 1.10 1.13 0.86 0.82 1.04
Current Ratio 1.83 1.90 1.32 1.44 1.76
Div Cover - - 34.97 0.82 4.24 -
189