
Page 189 - Profile's Stock Exchange Handbook - 2025 Issue 2
P. 189
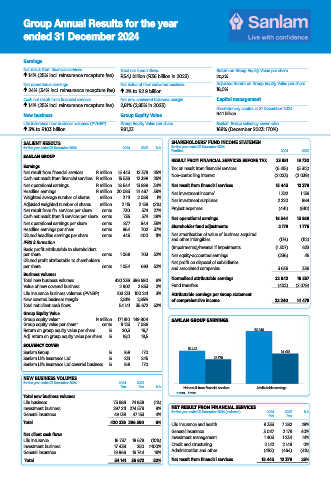
Group Annual Results for the year
ended 31 December 2024
Earnings
Net result from financial services Total net fund inflows Return on Group Equity Value per share
14% (25% incl. reinsurance recapture fee) R54,1 billion (R36 billion in 2023) 20,3%
Net operational earnings Net value of new convered business Adjusted Return on Group Equity Value per share
24% (34% incl. reinsurance recapture fee) 2% to R2.9 billion 18,0%
Cash net result from financial services Net new convered business margin Capital management
14% (25% incl. reinsurance recapture fee) 2,81% (2,85% in 2023)
Discretionary capital at 31 December 2024
New business Group Equity Value R4.1 billion
Life insurance new business volumes (PVNBP) Group Equity Value per share Sanlam Group solvency cover ratio
3% to R103 billion R81,23 168% (December 2023: 170%)
SALIENT RESULTS SHAREHOLDERS’ FUND INCOME STATEMEN
for the year ended 31 December 2024 2024 2023 % for the year ended 31 December 2024
R’million 2024 2023
SANLAM GROUP
RESULT FROM FINANCIAL SERVICES BEFORE TAX 23 881 19 730
Earnings Tax on result from financial services (6 415) (5 312)
Net result from financial services R million 15 443 12 379 25% Non-controlling interest (2 023) (2 039)
Cash net result from financial services R million 15 536 12 398 25%
Net operational earnings R million 18 544 13 889 34% Net result from financial services 15 443 12 379
Headline earnings R million 20 083 14 467 39% Net investment income` 1 322 1 136
Weighted average number of shares million 2 111 2 089 1% Net investment surpluses 2 220 984
Adjusted weighted number of shares million 2 115 2 158 (2%)
Net result from fin. services per share cents 730 574 27% Project expenses (441) (610)
Cash net result from fi.services per share cents 735 574 28% Net operational earnings 18 544 13 889
Net operational earnings per share cents 877 644 36% Shareholder fund adjustments 2 179 1 776
Headline earnings per share cents 964 702 37%
Diluted headline earnings per share cents 445 400 11% Net amortisation of value of business acquired (174) (112)
and other intangibles
IFRS information
Basic profit attributable to shareholders (Impairments)/reversal if impairments (1 307) 623
per share cents 1 068 703 52% Net equity-accounted earnings (236) 45
Diluted profit attributable to shareholders Net profit on disposal of subsidiaries
per share cents 1 054 693 52% and associated companies 3 636 336
Business volumes
Total new business volumes 420 236 396 590 6% Normalised attributable earnings 22 642 16 557
Value of new covered business 2 902 2 853 2% Fund transfers (402) (2 079)
Life insurance business volumes (PVNBP) 103 231 100 241 3% Attributable earnings per Group statement
New covered business margin 2,81% 2,85% of comprehensive income 22 240 14 478
Total net client cash flows 54 141 35 672 52%
Group Equity Value
Group equity value* R million 171 810 149 904 SANLAM GROUP EARNINGS
Group equity value per share* cents 8 123 7 086
Return on group equity value per share % 20,3 16,7 22 240
Adj. return on group equity value per share % 18,0 19,5
SOLVENCY COVER 15 443
Sanlam Group % 168 170 14 478
Sanlam Life Insurance Ltd % 231 245 12 379
Sanlam Life Insurance Ltd covered business % 168 170
NEW BUSINESS VOLUMES
for the year ended 31 December 2024 2024 2023
R’m R’m % Net result from financial services Attributable earnings
2024 2023
Total new business volumes
Life business 73 886 74 858 (1%)
Investment business 297 211 274 579 8% NET RESULT FROM FINANCIAL SERVICES
General insurance 49 139 47 153 4% for the year ended 31 December 2024 (reviewed) 2024 2023 %
R’m
R’m
Total 420 236 396 590 6% Life insurance and health 9 333 7 282 28%
General insurance 3 047 2 179 40%
Net client cash fl ows
Life insurance 16 737 18 678 (10%) Investment management 1 403 1 234 14%
Investment business 17 438 250 >100% Credit and structuring 2 142 2 148 0%
General insurance 19 966 16 744 19% Administration and other (482) (464) (4%)
Total 54 141 35 672 52% Net result from financial services 15 443 12 379 25%
08/05/2025 10:22:13
JSE R&E book AR2024 v20250508.indd 1
JSE R&E book AR2024 v20250508.indd 1 08/05/2025 10:22:13