
Page 188 - Profile's Stock Exchange Handbook - 2025 Issue 2
P. 188
JSE – SAN Profile’s Stock Exchange Handbook: 2025 – Issue 2
Int Cover 20.22 17.03 16.78 20.07 5.00
Sanlam Ltd. Current Ratio 1.62 1.73 1.90 1.62 0.83
Div Cover 2.40 1.76 1.66 1.38 0.12
SAN
*Please note that these line items for December 2024, 2023 and 2022 results relate to
continuing operations
NUMBER OF EMPLOYEES: 23 926
DIRECTORS: BirrellAS(ind ne), BothaAD(ne),
Essoka E (ind ne), KrugerNAS(ind ne),
Manyonga N (ind ne), Masilela E (ind ne),
MokokaMG(ind ne), MollerJP(ind ne),
NkosiSA(ne), NondumoKT(ind ne),
van Biljon W (ind ne), van Zyl Dr J (ne), Zinn S
ISIN: ZAE000070660 SHORT: SANLAM CODE: SLM A(ind ne), Mvusi T I (Chair, ind ne),
REG NO: 1959/001562/06 FOUNDED: 1918 LISTED: 1998 Motsepe Dr P T (Dep Chair, ne),
Hanratty P B (CEO), Mukhuba A (FD)
Scan the QR code to
NATURE OF BUSINESS: visit our website POSTAL ADDRESS: PO Box 1, Sanlamhof, 7532
EMAIL: ir@sanlam.co.za
Sanlam is a leading non-banking financial services group on WEBSITE: www.sanlam.com
the African continent, with a niche presence in Asia. Sanlam is COMPANY SECRETARY: Adela Fortune
a market leader in life insurance, generalinsurance and invest- TRANSFER SECRETARY: Computershare Investor Services (Pty) Ltd.
ment management in its home market of South Africa as well SPONSOR: Standard Bank of South Africa Ltd.
as other countries across the African continent. With a history AUDITORS: KPMG Inc., PwC Inc.
spanning over a century of serving clients, Sanlam has a BANKERS: Absa Bank Ltd.
well-established brand, leading industry skills and expertise, CALENDAR Expected Status
and high levels of customer loyalty. Annual General Meeting Jun 2025 Unconfirmed
Sanlam offers unrivalled long-term growth potential through
a unique platform that positions them to grow in countries Next Interim Results Sep 2025 Unconfirmed
with low insurance penetration and high long-term economic Next Final Results Mar 2026 Unconfirmed
growth prospects. As Sanlamgrows, it contributes to develop- CAPITAL STRUCTURE AUTHORISED ISSUED
ing financial service industries in the countries where it SLM Ords 1c ea 4 000 000 000 2 117 153 949
operates. Sanlam’s innovative partnership approach brings
scale and reach to its operations while supporting shared DISTRIBUTIONS [ZARc] Ldt Pay Amt
Ords 1c ea
value creation and financial inclusion. Sanlam works hard to
Final No 27 1 Apr 25 7 Apr 25 445.00
retain its clients’ trust and its leading reputation by maintain- Final No 26 2 Apr 24 8 Apr 24 400.00
ingthe highest ethicalandgovernancestandards andensuring Final No 25 3 Apr 23 11 Apr 23 360.00
it shares the benefit of its vast financial resources by investing Final No 24 5 Apr 22 11 Apr 22 334.00
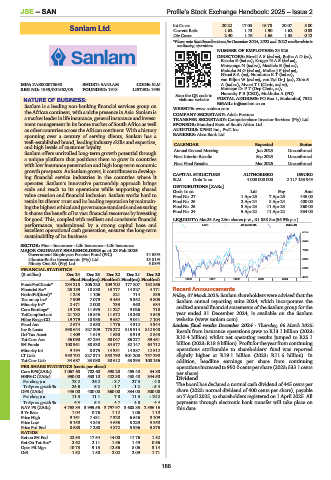
for good. This, coupled with resilient and consistent financial LIQUIDITY: Mar25 Avg 23m shares p.w., R1 858.8m(56.9% p.a.)
performance, underpinned by a strong capital base and LIFE 40 Week MA SANLAM
excellent operational cash generation, ensures the long-term
9122
sustainability of its business.
8243
SECTOR: Fins—Insurance—Life Insurance—Life Insurance
MAJOR ORDINARY SHAREHOLDERS as at 28 Feb 2025 7364
Government Employees Pension Fund (PIC) 14.53%
Ubuntu-Botho Investments (Pty) Ltd. 13.81% 6485
Ninety One SA (Pty) Ltd. 5.08%
FINANCIAL STATISTICS 5606
(R million) Dec 24 Dec 23 Dec 22 Dec 21 Dec 20
Final Final(rst) Final(rst) Final(rst) Final(rst) 2020 | 2021 | 2022 | 2023 | 2024 | 4727
FundsFmClients* 234 218 206 220 109 702 177 807 132 866
Financial Ser* 25 139 18 830 13 777 14 327 4 171 Recent Announcements
NetIntPd(Rcvd)* 1 243 1 106 821 714 835 Friday, 07 March 2025: Sanlam shareholders were advised that the
Tax on op inc* 7 909 7 079 3 464 5 352 3 805 Sanlam annual reporting suite 2024, which incorporates the
Minority Int* 2 471 2 008 733 960 684
Core Earnings* 19 133 11 595 11 227 9 026 718 audited annual financial statements of the Sanlam group for the
TotCompIncLoss 21 782 16 846 11 672 13 368 4 545 year ended 31 December 2024, is available on the Sanlam
Hline Erngs-CO 19 779 10 985 9 687 9 041 7 104 website (www.sanlam.com).
Fixed Ass 2 674 2 550 1 776 4 312 4 344 Sanlam final results December 2024 - Thursday, 06 March 2025:
Inv & Loans 998 644 827 309 773 272 815 914 812 948 Result from insurance operations grew to R13.1 billion (2023:
Def Tax Asset 1 409 1 619 1 630 3 319 2 843
Tot Curr Ass 56 090 57 294 58 047 86 277 89 451 R10.4 billion) whilst net operating results jumped to R25.1
SH Funds 100 961 88 530 84 577 82 147 64 712 billion (2023: R18.8 billion). Profit for the year from continuing
Minority Int 9 194 8 375 14 381 14 387 12 512 operations attributable to shareholders’ fund was reported
LT Liab 988 702 827 374 850 790 901 200 757 290 slightly higher at R19.1 billion (2023: R11.6 billion). In
Tot Curr Liab 34 687 33 038 30 612 53 393 108 156 addition, headline earnings per share from continuing
PER SHARE STATISTICS (cents per share) operationsincreasedto950.0 centsper share (2023: 533.1 cents
Core EPS(ZARc) 1 067.60 702.60 598.20 459.40 34.80 per share).
HEPS-C (ZARc) 950.00 533.10 422.30 438.40 344.50
Pct chng p.a. 78.2 26.2 - 3.7 27.3 - 4.8 Dividend
Tr 5yr av grwth % 24.6 5.2 - 1.7 - 1.2 - 5.4 The board has declared a normal cash dividend of 445 cents per
DPS (ZARc) 445.00 400.00 360.00 334.00 300.00 share (2023: normal dividend of 400 cents per share), payable
Pct chng p.a. 11.3 11.1 7.8 11.3 - 10.2 on 7 April 2025, to shareholders registered on 1 April 2025. All
Tr 5yr av grwth % 6.3 5.4 4.7 4.8 4.4 payments through electronic bank transfer will take place on
NAV PS (ZARc) 4 768.83 3 999.55 3 797.97 3 688.85 2 856.16 this date.
3 Yr Beta 1.04 0.76 1.12 1.06 1.10
Price High 9 161 7 431 7 320 6 546 8 109
Price Low 6 150 4 843 4 686 5 229 3 850
Price Prd End 8 688 7 280 4 872 5 936 5 875
RATIOS
Ret on SH Fnd 22.55 17.54 14.00 11.76 1.82
Ret On Tot Ass* 2.62 2.11 1.56 1.49 0.56
Oper Pft Mgn 10.73 9.13 12.56 8.06 3.14
D:E 1.52 1.58 2.02 2.09 1.71
186