
Page 183 - Profile's Stock Exchange Handbook - 2025 Issue 2
P. 183
Profile’s Stock Exchange Handbook: 2025 – Issue 2 JSE – RFG
RFG Holdings Ltd. RH Bophelo Ltd.
RFG RHB
ISIN: ZAE000191979 SHORT: RFG CODE: RFG ISIN: ZAE000244737 SHORT: RHBOPHELO CODE: RHB
REG NO: 2012/074392/06 FOUNDED: 2012 LISTED: 2014 REG NO: 2016/533398/06 FOUNDED: 2016 LISTED: 2017
NATURE OF BUSINESS: RFG is a leading producer of convenience meal NATURE OF BUSINESS: RH Bophelo Ltd. (RHB) is a Pan-African
solutions for customers throughout South Africa, sub-Saharan Africa and Johannesburg Stock Exchange (JSE) listed Section 15 Investment Holding
multiple major global markets. Company specialising in investing in the healthcare andhealthcare-related
Founded in 1896, RFG was listed on the JSE Ltd. in 2014. Since the listing service sectors.
the group has concluded 10 acquisitions to expand and diversify its The Company’s investment thesis and strategy are focused on identifying
product offering and customer base and extend its market-leading brands strategic investment opportunities in the healthcare sector while creating
into new product categories. an ecosystem designed to optimise synergies and deliver value to South
SECTOR: CnsStp—FoodBev&Tob—Food Producers—Food Products Africans and Africans.
NUMBER OF EMPLOYEES: 3 401 SECTOR: DEVC
DIRECTORS: Angamia Z R (ne), Blok T (ind ne), Maitisa S (ind ne), NUMBER OF EMPLOYEES: 742
NaidooS(ind ne), Njobe B (ind ne), Willis G J H (ne), Muthien Dr Y G DIRECTORS: Clarke C W, Makhubela R (ind ne), Makwetla F (ne),
(Chair, ind ne), Hanekom P (CEO), Schoombie C C (CFO) Mashau T (ind ne), Mpelwane C (ind ne), Segooa B (ne),
MAJOR ORDINARY SHAREHOLDERS as at 29 Sep 2024 Sekete DrPD(ne), Moraba S (Chair, ind ne), Zunga Q (CEO & MD),
Capitalworks Private Equity GP (Pty) Ltd. 37.30% Metu A Y (CFO)
Old Mutual 11.50% MAJOR ORDINARY SHAREHOLDERS as at 29 Feb 2024
PSG Konsult 9.00% Public Investment Corporation 66.00%
POSTAL ADDRESS: Private Bag X3040, Paarl, 7620 Perthpark Properties 12.00%
MORE INFO: www.sharedata.co.za/sdo/jse/RFG Dr Mandisa Joyce Gwendoline 3.00%
COMPANY SECRETARY: Zantira Annandakrisnan POSTAL ADDRESS: Unit 12, 1st floor, 1 Melrose Boulevard, Melrose Arch,
TRANSFER SECRETARY: Computershare Investor Services (Pty) Ltd. 2191
SPONSOR: Rand Merchant Bank (A division of FirstRand Bank Ltd.) MORE INFO: www.sharedata.co.za/sdo/jse/RHB
AUDITORS: Ernst & Young COMPANY SECRETARY: Statucor (Pty) Ltd.
TRANSFER SECRETARY: Computershare Investor Services (Pty) Ltd.
CAPITAL STRUCTURE AUTHORISED ISSUED SPONSOR: Deloitte & Touche Sponsor Services (Pty) Ltd.
RFG Ords no par value 1 800 000 000 262 762 018
AUDITORS: Mazars South Africa
DISTRIBUTIONS [ZARc] CAPITAL STRUCTURE AUTHORISED ISSUED
Ords no par value Ldt Pay Amt RHB Ords no par 10 000 000 000 64 691 298
Final No 10 21 Jan 25 27 Jan 25 111.10
Final No 9 16 Jan 24 22 Jan 24 62.00 DISTRIBUTIONS [ZARc]
Ords no par Ldt Pay Amt
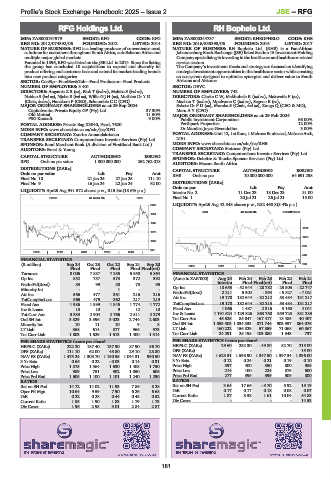
LIQUIDITY: Apr25 Avg 941 572 shares p.w., R15.8m(18.6% p.a.) Interim No 2 11 Dec 23 18 Dec 23 31.00
FOOD 40 Week MA RFG Final No 1 20 Jul 21 26 Jul 21 15.00
2200 LIQUIDITY: Apr25 Avg 42 548 shares p.w., R82 468.8(3.4% p.a.)
EQII 40 Week MA RHBOPHELO
1924
1648
1572
1373
1229
1097
886
821
2020 | 2021 | 2022 | 2023 | 2024 |
543
FINANCIAL STATISTICS
(R million) Sep 24 Oct 23 Oct 22 Sep 21 Sep 20 2020 | 2021 | 2022 | 2023 | 200
Final Final Final Final Final(rst)
Turnover 8 006 7 887 7 255 5 950 5 864 FINANCIAL STATISTICS
Op Inc 852 757 573 372 392 (Amts in ZAR’000) Aug 24 Feb 24 Feb 23 Feb 22 Feb 21
NetIntPd(Rcvd) 83 99 88 73 95 Interim Final Final(rst) Final Final
Minority Int - - 1 - - Op Inc - 18 653 - 52 644 - 28 782 - 25 803 - 22 747
Att Inc 566 477 361 216 216 NetIntPd(Rcvd) 2 211 5 302 - 394 - 5 827 - 7 021
TotCompIncLoss 565 479 362 217 219 Att Inc 19 170 182 644 - 32 212 53 484 131 217
Fixed Ass 1 986 1 899 1 845 1 774 1 772 TotCompIncLoss 19 170 182 644 - 32 213 53 484 131 217
Inv & Loans 13 10 9 12 10 Fixed Ass 1 066 1 487 2 316 3 160 4 041
Tot Curr Ass 3 333 2 904 2 766 2 511 2 279 Inv & Loans 1 191 624 1 129 826 863 750 959 723 881 233
Ord SH Int 3 829 3 396 3 023 2 744 2 603 Tot Curr Ass 45 326 85 047 167 417 13 485 40 407
Minority Int 10 11 10 9 8 Ord SH Int 1 053 503 1 034 333 871 744 903 957 864 076
LT Liab 368 614 877 966 973 LT Liab 160 222 156 829 57 859 71 068 60 867
Tot Curr Liab 1 803 1 529 1 513 1 400 1 314 Tot Curr Liab 24 291 25 198 103 880 1 343 737
PER SHARE STATISTICS (cents per share) PER SHARE STATISTICS (cents per share)
HEPS-C (ZARc) 222.20 187.40 137.90 87.90 86.70 HEPS-C (ZARc) 29.60 282.30 - 49.80 82.70 218.00
DPS (ZARc) 111.10 62.00 45.80 29.10 28.80 DPS (ZARc) - - - - 15.00
NAV PS (ZARc) 1 475.24 1 305.70 1 150.55 1 044.31 990.50 NAV PS (ZARc) 1 628.51 1 598.90 1 347.50 1 397.34 1 336.00
3 Yr Beta 0.66 0.22 - 0.03 0.14 0.31 3 Yr Beta 0.12 0.24 0.21 0.19 0.10
Price High 1 875 1 364 1 630 1 408 1 750 Price High 397 400 550 800 985
Price Low 989 751 902 1 050 606 Price Low 214 100 224 375 500
Price Prd End 1 605 1 100 1 101 1 240 1 290 Price Prd End 277 399 399 509 800
RATIOS RATIOS
Ret on SH Fnd 14.72 14.02 11.93 7.86 8.28 Ret on SH Fnd 3.64 17.66 - 3.70 5.92 15.19
Oper Pft Mgn 10.64 9.59 7.90 6.26 6.68 D:E 0.17 0.17 0.18 0.08 0.07
D:E 0.22 0.28 0.44 0.48 0.52 Current Ratio 1.87 3.38 1.61 10.04 54.83
Current Ratio 1.85 1.90 1.83 1.79 1.73 Div Cover - - - - 14.53
Div Cover 1.96 2.95 3.01 2.84 2.87
181