
Page 163 - Profile's Stock Exchange Handbook - 2025 Issue 2
P. 163
Profile’s Stock Exchange Handbook: 2025 – Issue 2 JSE – OCT
Octodec Investments Ltd. Old Mutual Ltd.
OCT OLD
ISIN: ZAE000192258 ISIN: ZAE000255360 SHORT: OMUTUAL CODE: OMU
SHORT: OCTODEC REG NO: 2017/235138/06 FOUNDED: 2017 LISTED: 2018
CODE: OCT NATURE OF BUSINESS: Old Mutual is a premium African financial
REG NO: 1956/002868/06 services group that offers a broad spectrum of financial solutions to retail
FOUNDED: 1956 and corporate customers across key markets segments in 14 countries. Old
LISTED: 1990 Mutual’s primary operations are in South Africa and the rest of Africa, and
NATURE OF BUSINESS: Octodec Investments Ltd. (Octodec or the it has a niche business in China. With over 176 years of heritage across
company), its subsidiaries and associated company (the group) is a real sub-Saharan Africa, Old Mutual is a crucial part of the communities we
estate investment trust (REIT) listed on the JSE Ltd. (JSE) with a serve and broader society on the continent.
diversified portfolio of 234 residential, retail, office and industrial
properties situated in the major metropolitan areas of Tshwane and SECTOR: Fins—Insurance—Life Insurance—Life Insurance
Johannesburg. The portfolio, including an equity-accounted joint venture, NUMBER OF EMPLOYEES: 31 032
has a lettable area of 1 524 479m 2 and is valued at R11.2 billion. DIRECTORS: Armstrong Dr B (ind ne), Ighodaro O (ind ne),
SECTOR: RealEstate—RealEstate—REITS—Retail Kgaboesele I (ind ne), Langer J (ind ne), ListerJR(ind ne, UK),
NUMBER OF EMPLOYEES: 189 Magwentshu-RensburgSM(ld ind ne), Mokgosi-Mwantembe T (ind ne),
DIRECTORS: Erasmus R (Deputy CE & FD), Buchholz R (ind ne), MwangiJI(ind ne, Keny), Silwanyana B (ind ne), StrydomJJ(ind ne),
MabundaNC(ind ne), MojapeloEMS(ind ne), PollackMZ(ne), van GraanSW(ind ne), Manuel T (Chair, ind ne), Nqweni N (Chair),
StrydomPJ(ld ind ne), Van BredaLP(ind ne), Wapnick J P (MD), Williamson I G (CEO), Troskie C G (CFO)
Vieira A (FD), Wapnick S (Chair, ne) MAJOR ORDINARY SHAREHOLDERS as at 20 Nov 2024
MAJOR ORDINARY SHAREHOLDERS as at 30 Sep 2024 Public Investment Corporation 16.12%
Lefkopaul CC 7.59% Allan Gray 5.99%
Tomnef Investments (Pty) Ltd. 6.89% BlackRock Inc 5.38%
City Property Administration 4.76% POSTAL ADDRESS: PO Box 66, Cape Town, South Africa, 8000
POSTAL ADDRESS: PO Box 15, Tshwane, 0001 MORE INFO: www.sharedata.co.za/sdo/jse/OMU
EMAIL: info@octodec.co.za COMPANY SECRETARY: E M Kirsten
WEBSITE: www.octodec.co.za TRANSFER SECRETARY: JSE Investor Services (Pty) Ltd.
TELEPHONE: 012-319-8781 SPONSOR: Tamela Holdings (Pty) Ltd.
GROUP COMPANY SECRETARY: Elize Greeff AUDITORS: Deloitte & Touche Inc., Ernst & Young
TRANSFER SECRETARY: Computershare Investor Services (Pty) Ltd.
SPONSOR: Java Capital CAPITAL STRUCTURE AUTHORISED ISSUED
AUDITORS: Ernst & Young Inc. OMU Ords 100c ea 10 000 000 000 4 712 897 403
CAPITAL STRUCTURE AUTHORISED ISSUED DISTRIBUTIONS [ZARc]
OCT Ords no par 500 000 000 266 197 535 Ords 100c ea Ldt Pay Amt
DISTRIBUTIONS [ZARc] Final No 13 8 Apr 25 14 Apr 25 52.00
Ords no par Ldt Pay Amt Interim No 12 15 Oct 24 21 Oct 24 34.00
Final No 66 10 Dec 24 17 Dec 24 65.00 LIQUIDITY: Apr25 Avg 77m shares p.w., R931.4m(85.4% p.a.)
Interim No 65 4 Jun 24 10 Jun 24 60.00
LIFE 40 Week MA OMUTUAL
LIQUIDITY: Mar25 Avg 958 940 shares p.w., R10.3m(18.7% p.a.)
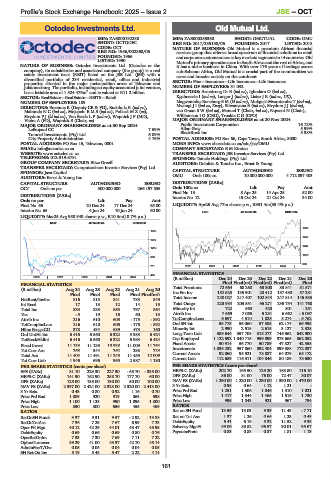
REIV 40 Week MA OCTODEC
1688
1733
1467
1477
1247
1222
1026
966
806
711 2020 | 2021 | 2022 | 2023 | 2024 |
FINANCIAL STATISTICS
455
2020 | 2021 | 2022 | 2023 | 2024 | (R million) Dec 24 Dec 23 Dec 22 Dec 21 Dec 20
Final Final(rst) Final(rst) Final(rst) Final
FINANCIAL STATISTICS
(R million) Aug 24 Aug 23 Aug 22 Aug 21 Aug 20 Total Premiums 72 664 68 260 63 300 83 841 81 571
Final Final Final Final Final(rst) Inc Fm Inv 152 623 135 901 20 412 157 480 57 281
NetRent/InvInc 816 813 841 783 849 Total Income 240 027 217 407 102 844 247 814 146 533
Int Recd 17 13 12 14 15 Total Outgo 223 984 203 551 96 271 235 754 141 768
Total Inc 833 838 853 797 864 Minority Int 722 568 420 801 - 251
Tax - 5 19 16 60 13 Attrib Inc 7 669 7 065 5 231 6 662 - 5 097
Attrib Inc 216 610 605 - 175 - 892 TotCompIncLoss 6 697 4 510 1 825 8 274 - 5 762
TotCompIncLoss 216 610 605 - 175 - 892 Ord SH Int 58 775 56 060 57 585 62 174 66 995
Hline Erngs-CO 378 434 689 473 160 Minority Int 2 990 2 515 2 615 3 127 2 328
Ord UntHs Int 6 416 6 560 6 322 5 983 6 424 Long-Term Liab 389 644 357 708 315 277 746 562 642 900
TotStockHldInt 6 416 6 560 6 322 5 983 6 424 Cap Employed 1 122 592 1 040 715 959 899 973 665 862 052
Fixed Invest 11 133 11 135 10 938 11 009 11 764 Fixed Assets 50 914 56 770 50 789 47 827 42 558
Tot Curr Ass 268 344 262 298 223 Investments 1 035 232 957 860 892 404 899 388 772 037
Total Ass 11 404 11 491 11 245 11 455 12 009 Current Assets 92 060 95 921 78 887 64 079 65 172
Tot Curr Liab 1 946 696 955 2 587 1 180 Current Liab 112 689 116 311 104 846 80 189 78 630
PER SHARE STATISTICS (cents per share) PER SHARE STATISTICS (cents per share)
EPS (ZARc) 81.10 229.30 227.30 - 65.70 - 335.00 HEPS-C (ZARc) 202.70 165.50 129.20 163.80 116.10
HEPS-C (ZARc) 141.90 162.90 258.70 177.70 60.00 DPS (ZARc) 86.00 81.00 76.00 72.47 30.07
DPS (ZARc) 125.00 135.00 130.00 50.00 100.00 NAV PS (ZARc) 1 290.00 1 220.00 1 230.00 1 390.00 1 470.00
NAV PS (ZARc) 2 397.00 2 424.00 2 328.00 2 320.00 2 413.00 3 Yr Beta 0.98 0.64 1.12 1.21 -
3 Yr Beta 0.43 0.80 0.92 1.16 0.70 Price Prd End 1 251 1 306 1 046 1 310 1 021
Price Prd End 1 089 920 919 863 598 Price High 1 417 1 344 1 465 1 515 1 730
Price High 1 100 1 125 990 1 095 1 800 Price Low 995 1 043 921 967 794
Price Low 850 800 656 455 469 RATIOS
RATIOS Ret on SH Fund 13.59 13.03 9.39 11.43 - 7.71
RetOnSH Funds 3.37 9.31 9.57 - 2.92 - 13.88 Ret on Tot Ass 1.37 1.26 0.66 1.23 0.48
RetOnTotAss 7.36 7.29 7.67 6.99 7.23 Debt:Equity 6.41 6.19 5.32 11.52 9.35
Oper Pft Mgn 40.12 42.29 44.01 43.47 45.95 Solvency Mgn% 89.06 89.82 96.57 90.01 95.67
Debt:Equity 0.69 0.66 0.69 0.80 0.76 Payouts:Prem 0.83 0.83 0.87 1.81 1.13
OperRetOnInv 7.33 7.30 7.69 7.11 7.22
OpInc:Turnover 39.29 41.00 43.37 42.70 45.14
AdminFee:T/Ovr 0.05 0.05 0.04 0.04 0.05
SH Ret On Inv 5.19 5.48 5.47 2.22 4.14
161