
Page 180 - Profile's Stock Exchange Handbook - 2025 Issue 1
P. 180
JSE – REN Profile’s Stock Exchange Handbook: 2025 – Issue 1
Renergen Ltd. Resilient REIT Ltd.
REN RES
ISIN: ZAE000202610 SHORT: RENERGEN CODE: REN ISIN: ZAE000209557 SHORT: RESILIENT CODE: RES
REG NO: 2014/195093/06 FOUNDED: 2014 LISTED: 2015 REG NO: 2002/016851/06 FOUNDED: 2002 LISTED: 2002
NATURE OF BUSINESS: Renergen is a liquefied helium and liquefied NATURE OF BUSINESS: Resilient has been listed on the JSE since 6
natural gas producer with the country’s only onshore Petroleum December 2002 and is a retail-focused Real Estate Investment Trust
Production Right (issued by the Department of Mineral Resources and (“REIT”).Itsstrategyistoinvestindominantretailcentreswithaminimum
Energy (DMRE). of three anchor tenants and let predominantly to national retailers.
Renergen’s principal asset is our 94,5% equity ownership in Tetra4, the SECTOR: RealEstate—RealEstate—REITS—Retail
entity developing the Virginia Gas Project. NUMBER OF EMPLOYEES: 30
SECTOR: AltX DIRECTORS: Bird S (ind ne), GordonDK(ind ne), Kriek J J, Marole M L
NUMBER OF EMPLOYEES: 66 D(ind ne), Phili P (ind ne), SishubaTS(ind ne), van WykBD(ind ne),
DIRECTORS: Hlatshwayo D (ind ne), SwanaMB(ind ne), Olivier A (Chair, ind ne), de Beer D (CEO), Muller M (CFO)
King D C (Chair, ne, UK), Marani S (CEO), Harvey B (FD), Mitchell N MAJOR ORDINARY SHAREHOLDERS as at 10 Jan 2025
(COO) Public Investment Corporation SOC Ltd. 15.71%
MAJOR ORDINARY SHAREHOLDERS as at 11 Jul 2024 Delsa Investments (Pty) Ltd. 8.80%
Mazi Asset Management 8.79% Resilient Properties (Pty) Ltd. 8.26%
MATC Investment (Pty) Ltd. 5.91% POSTAL ADDRESS: PO Box 2555, Rivonia, 2128
CRT Investment Holding (Pty) Ltd. 5.83% MORE INFO: www.sharedata.co.za/sdo/jse/RES
POSTALADDRESS:PostnetSuite610,PrivateBagX10030,Randburg,2125 COMPANY SECRETARY: Sue Hsieh
MORE INFO: www.sharedata.co.za/sdo/jse/REN TRANSFER SECRETARY: JSE Investor Services (Pty) Ltd.
COMPANY SECRETARY: Acorim (Pty) Ltd. SPONSOR: Java Capital (Pty) Ltd.
TRANSFER SECRETARY: Computershare Investor Services (Pty) Ltd. AUDITORS: PwC Inc.
DESIGNATED ADVISOR: PSG Capital (Pty) Ltd.
AUDITORS: Mazars CAPITAL STRUCTURE AUTHORISED ISSUED
RES Ords no par value 1 000 000 000 365 204 738
CAPITAL STRUCTURE AUTHORISED ISSUED
REN Ords no par value 500 000 000 147 670 977 DISTRIBUTIONS [ZARc]
Ords no par value Ldt Pay Amt
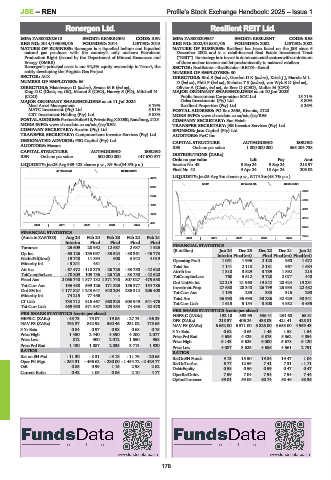
LIQUIDITY: Jan25 Avg 989 428 shares p.w., R9.9m(34.8% p.a.) Interim No 43 3 Sep 24 9 Sep 24 218.97
Final No 42 9 Apr 24 15 Apr 24 203.02
40 Week MA RENERGEN
LIQUIDITY: Jan25 Avg 3m shares p.w., R174.3m(48.7% p.a.)
4270
REIV 40 Week MA RESILIENT
3507
6266
2744
5563
1981
4861
1218
4158
455
2020 | 2021 | 2022 | 2023 | 2024 |
3456
FINANCIAL STATISTICS
(Amts in ZAR’000) Aug 24 Feb 24 Feb 23 Feb 22 Feb 21 2020 | 2021 | 2022 | 2023 | 2024 | 2753
Interim Final Final Final Final
Turnover 25 609 28 952 12 687 2 637 1 925 FINANCIAL STATISTICS
Dec 23
Jun 24
Op Inc - 65 126 - 135 097 - 35 524 - 38 361 - 46 773 (R million) Interim Final(rst) Dec 22 Dec 21 Jun 21
Final Final(rst) Final(rst)
NetIntPd(Rcvd) 19 748 11 894 908 3 942 4 019 Operatng Proft 1 051 1 996 2 128 950 1 672
Minority Int - 3 241 481 - - - Total Inc 1 141 2 118 2 181 967 1 684
Att Inc - 67 472 - 110 273 - 26 725 - 33 750 - 42 620 Attrib Inc 1 310 3 529 3 789 1 892 213
TotCompIncLoss - 70 809 109 756 - 26 725 - 33 750 - 42 620 TotCompIncLoss 760 3 612 3 720 2 077 440
Fixed Ass 2 066 740 1 877 132 1 371 748 807 027 475 558 Ord UntHs Int 22 219 21 968 19 842 20 424 19 231
Tot Curr Ass 196 488 599 126 171 525 156 377 154 786 Investmnt Prop 27 680 28 348 26 799 23 933 22 482
Ord SH Int 1 177 827 1 243 647 840 204 286 312 206 408 Tot Curr Ass 1 193 285 338 316 290
Minority Int 74 215 77 456 - - -
Total Ass 36 990 35 698 33 236 32 429 30 341
LT Liab 733 712 816 467 860 323 803 949 541 476 Tot Curr Liab 1 615 5 154 3 808 4 982 3 435
Tot Curr Liab 469 630 571 557 200 354 74 433 32 478
PER SHARE STATISTICS (cents per share)
PER SHARE STATISTICS (cents per share) HEPS-C (ZARc) 192.10 393.95 536.41 231.60 65.31
HEPS-C (ZARc) - 45.73 - 75.07 - 19.86 - 27.73 - 36.29 DPS (ZARc) 218.97 406.24 438.03 421.41 428.81
NAV PS (ZARc) 798.37 842.98 580.46 231.02 175.65 NAV PS (ZARc) 6 652.00 6 571.00 5 826.00 5 658.00 4 959.43
3 Yr Beta 0.84 0.97 0.98 0.68 0.75 3 Yr Beta 0.62 0.63 1.45 1.58 1.54
Price High 1 450 2 440 4 390 4 200 2 077 Price Prd End 4 686 4 429 5 375 5 562 4 854
Price Low 812 900 2 012 1 550 958 Price High 5 143 5 625 6 000 5 678 5 120
Price Prd End 1 130 1 087 2 035 3 713 1 920 Price Low 4 087 3 625 4 686 4 561 2 791
RATIOS RATIOS
Ret on SH Fnd - 11.30 - 8.31 - 3.18 - 11.79 - 20.65 RetOnSH Funds 9.13 15.50 19.84 19.47 1.04
Oper Pft Mgn - 254.31 - 466.62 - 280.00 - 1 454.72 - 2 429.77 RetOnTotAss 6.77 12.59 7.41 7.31 - 1.71
D:E 0.85 0.99 1.15 2.98 2.62 Debt:Equity 0.58 0.56 0.59 0.47 0.47
Current Ratio 0.42 1.05 0.86 2.10 4.77
OperRetOnInv 7.59 7.04 7.94 7.94 7.44
OpInc:Turnover 59.01 59.05 60.74 58.46 58.36
178